
Reason to trust
How Our News is Made
Strict editorial policy that focuses on accuracy, relevance, and impartiality
Ad discliamer
Morbi pretium leo et nisl aliquam mollis. Quisque arcu lorem, ultricies quis pellentesque nec, ullamcorper eu odio.
- Bitcoin price is slowly declining and recently broke the $10,000 support area against the US Dollar.
- The price is facing an uphill task and it might continue to struggle near $10,250 and $10,300.
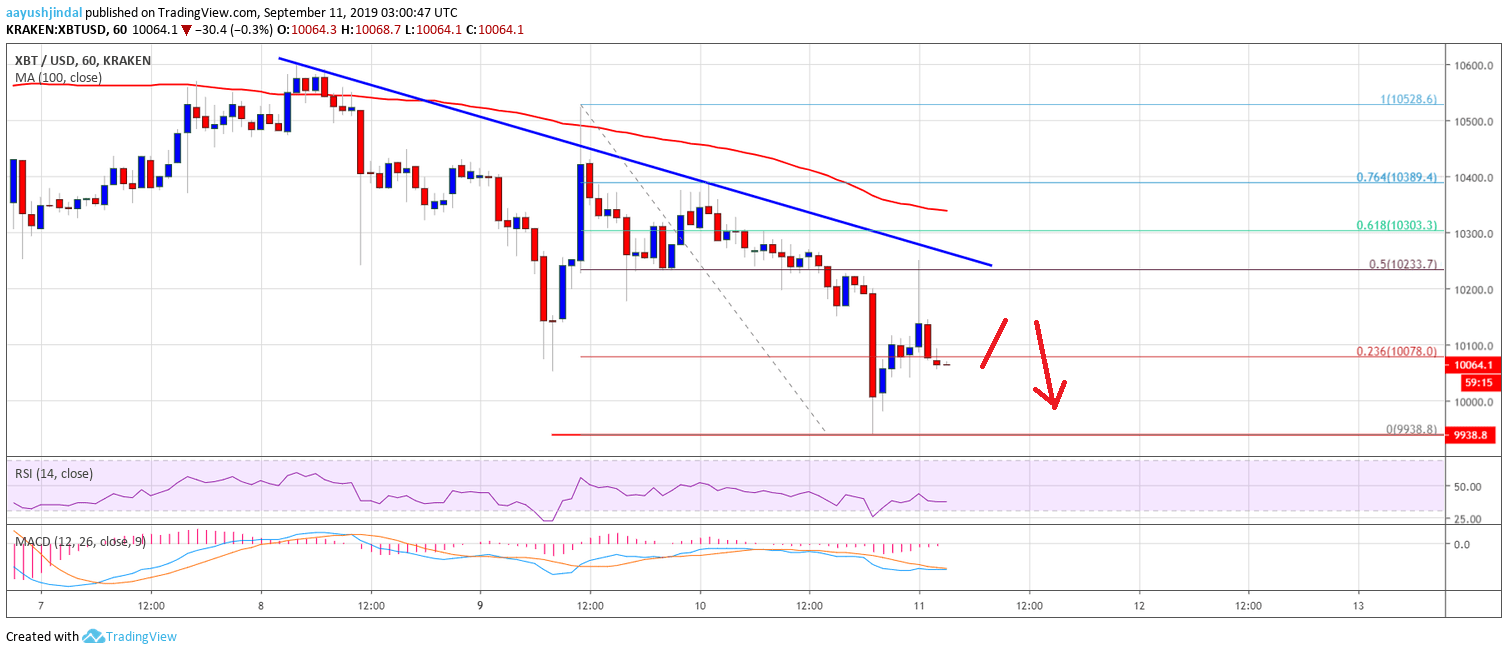
- There is a major bearish trend line forming with resistance near $10,250 on the hourly chart of the BTC/USD pair (data feed from Kraken).
- The price could continue to slide as long as it is trading below the $10,400 pivot level in the near term.
Bitcoin price is under pressure below $10,250 against the US Dollar. BTC may perhaps accelerate decline as long as there is no close above the $10,400 and $10,500 levels.
Bitcoin Price Analysis
In the last two analysis, we discussed the chances of more downsides in bitcoin price below $10,400 against the US Dollar. The price broke the $10,250 support area and the 100 hourly simple moving average. Moreover, the recent decline was such that the price broke the $10,100 support area. Finally, there was a downside spike below the $10,000 level and a new swing low was formed near the $9,938.
Recently, there was an upside correction above the $10,000 level. Moreover, the price broke the 23.6% Fib retracement level of the recent slide from the $10,528 high to $9,938 low. However, the upward move was capped by the $10,200 and $10,250 levels. There is also a major bearish trend line forming with resistance near $10,250 on the hourly chart of the BTC/USD pair.
Additionally, the 50% Fib retracement level of the recent slide from the $10,528 high to $9,938 low is acting as a resistance for the bulls. Above the trend line, the next key resistance is near the $10,350 level and the 100 hourly SMA. Having said that, a successful close above the $10,400 level plus the 61.8% Fib retracement level of the recent slide from the $10,528 high to $9,938 low is needed for more gains.
On the downside, the $10,000 level is an immediate support. However, the main support is near the $9,950 level. Below $9,950, there are chances of further losses in the near term. The next key support is near the $9,800 level.
Looking at the chart, bitcoin price is clearly under pressure and it could continue to slide below $10,000 in the coming sessions. If there is a bearish break below the $9,950 level, the price could head towards the $9,800 level. The main pivot level is near the $9,500 level.
Technical indicators:
Hourly MACD – The MACD is still moving in the bearish zone.
Hourly RSI (Relative Strength Index) – The RSI for BTC/USD is well below the 50 level.
Major Support Levels – $10,000 followed by $9,950.
Major Resistance Levels – $10,200, $10,250 and $10,350.


