
Reason to trust
How Our News is Made
Strict editorial policy that focuses on accuracy, relevance, and impartiality
Ad discliamer
Morbi pretium leo et nisl aliquam mollis. Quisque arcu lorem, ultricies quis pellentesque nec, ullamcorper eu odio.
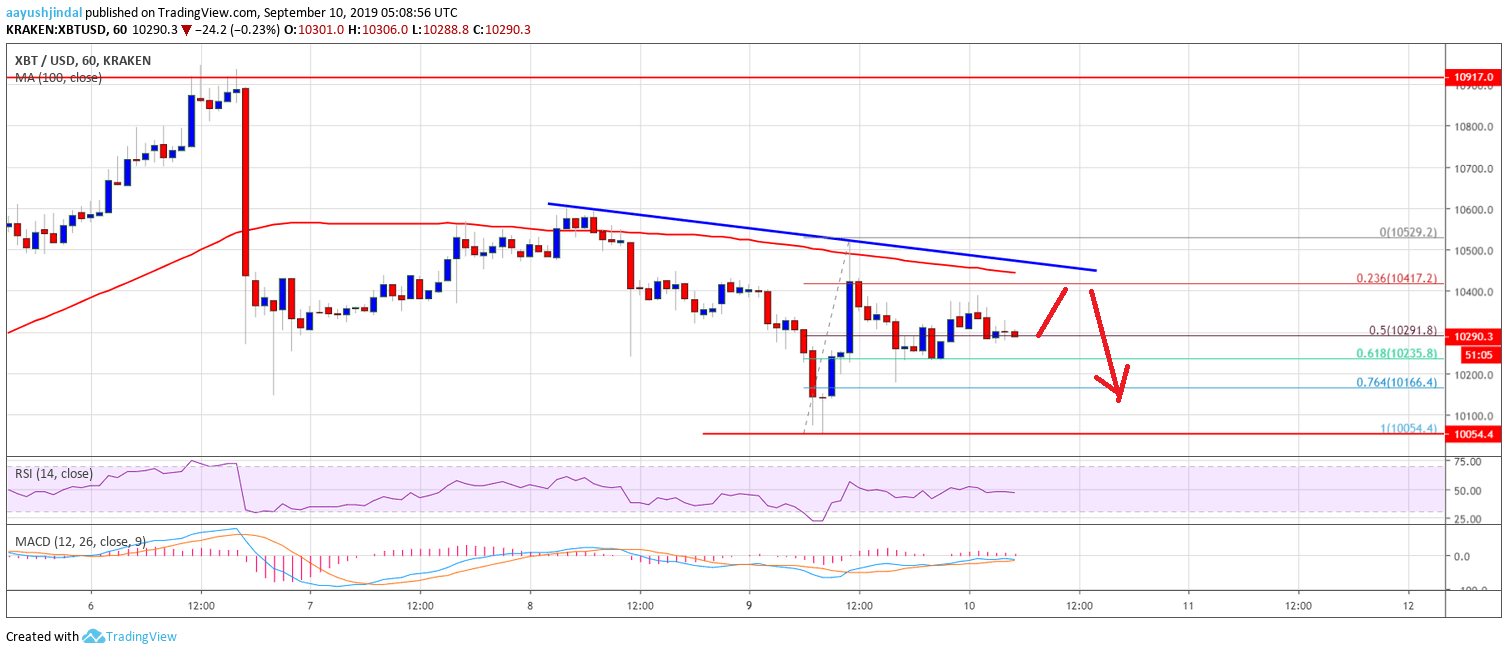
- Bitcoin price is jumped higher recently, but it struggled to continue above $10,500 against the US Dollar.
- The price is currently trading in a bearish zone and it could accelerate losses below $10,200 in the near term.
- There is a connecting bearish trend line forming with resistance near $10,450 on the hourly chart of the BTC/USD pair (data feed from Kraken).
- The price is slowly turning sell on rallies near the $10,450 and $10,500 levels.
Bitcoin price is currently trading in a range below $10,500 against the US Dollar. BTC could decline further if it continues to struggle below the $10,500 level.
Bitcoin Price Analysis
In the past few sessions, bitcoin price remained in a bearish zone below $10,600 against the US Dollar. The decline was such that the BTC/USD pair broke the $10,200 support area as well. Moreover, the price spiked below the $10,100 level. A new swing low was formed near the $10,054 and recently the price corrected higher. It spiked above $10,400, but the bulls failed to gain traction above the $10,500 level.
A swing high was formed near $10,529 and the price is currently correcting lower. The price broke the $10,400 level plus the 50% Fib retracement level of the last wave from the $10,054 low to $10,529 high. Moreover, the price is trading well below the $10,350 level and the 100 hourly simple moving average. An immediate support is near the $10,250 level and the 61.8% Fib retracement level of the last wave from the $10,054 low to $10,529 high.
If there is a downside break below the $10,250 support, the price could revisit the $10,050 support area. Any further losses could accelerate decline below the $10,050 and $10,000 levels. A clear break below the $10,000 level might call for a drop to $9,500.
On the upside, an immediate resistance is near the $10,350 and $10,400 levels. Moreover, there is a connecting bearish trend line forming with resistance near $10,450 on the hourly chart of the BTC/USD pair. The 100 hourly SMA is also near the $10,400 level. Therefore, it won’t be easy for the bulls to push the price above the $10,400 and $10,500 resistance levels.
Looking at the chart, bitcoin price is facing an increase in selling interest below the $10,500 level. As long as the price is trading below the $10,500 level, there are chances of more downsides. If not, the price could surge towards the $11,000 level.
Technical indicators:
Hourly MACD – The MACD is about to move back into the bearish zone.
Hourly RSI (Relative Strength Index) – The RSI for BTC/USD is now just below the 50 level.
Major Support Levels – $10,250 followed by $10,050.
Major Resistance Levels – $10,400, $10,500 and $10,550.


