Reason to trust

How Our News is Made
Strict editorial policy that focuses on accuracy, relevance, and impartiality
Ad discliamer
Morbi pretium leo et nisl aliquam mollis. Quisque arcu lorem, ultricies quis pellentesque nec, ullamcorper eu odio.
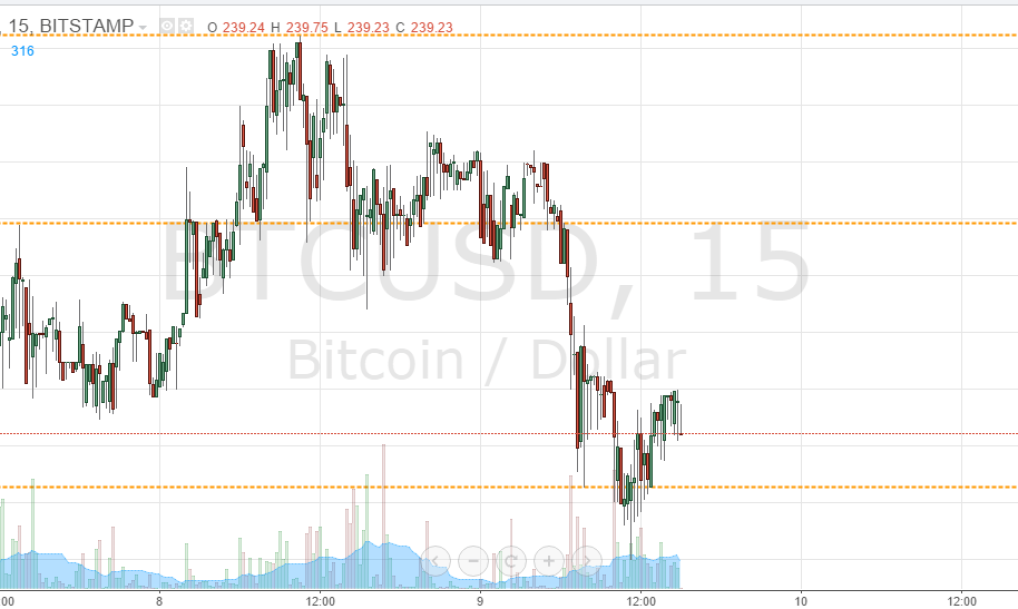
As we have seen so many times over the past few weeks, and as we mentioned in yesterday’s bitcoin price watch piece, the breakout action we have seen as late has often come during the Asian session (overnight Europe). We closed out yesterday’s session with a couple of key parameters that we were looking to watch overnight, and low and behold, the bitcoin price broke through the upside of these parameters shortly after 5 AM GMT, and having done so, proceeded to carve out fresh weekly highs. With this said, what are the levels that we are keeping an eye on in the bitcoin price today, have things change from last night, and where will be looking to get in and out markets according to our intraday strategy if we get further volatility? Take a quick look at the chart.

As you see, with yesterday’s breakout, in term support now sits at 229.70 while in term resistance sits at aforementioned intraday highs of 232.99. These are the two levels that we will be watching during today’s session as our range defining parameters.
We will continue to look to the upside initially, so if we get a break above 232.99 we will look for a close above this level on the 15 minute intraday chart to validate an upside bias and a medium-term upside target of 236 flat. A stop loss somewhere around 231 should help to maintain a positive risk reward profile on this trade.
Looking the other way, a break below 229.70 would bring 226.27 into play short-term. On the short trade, a stop loss around 228 flat will keep things attractive from a risk management perspective while still leaving us enough room to avoid being chopped out in the event that the bitcoin price reverses and returns to trade within range on a temporary basis.
Charts courtesy of Trading View


It will hold until the weekend when it will drop again like it does every single weekend.