Reason to trust

How Our News is Made
Strict editorial policy that focuses on accuracy, relevance, and impartiality
Ad discliamer
Morbi pretium leo et nisl aliquam mollis. Quisque arcu lorem, ultricies quis pellentesque nec, ullamcorper eu odio.
Bitcoin Price Analysis
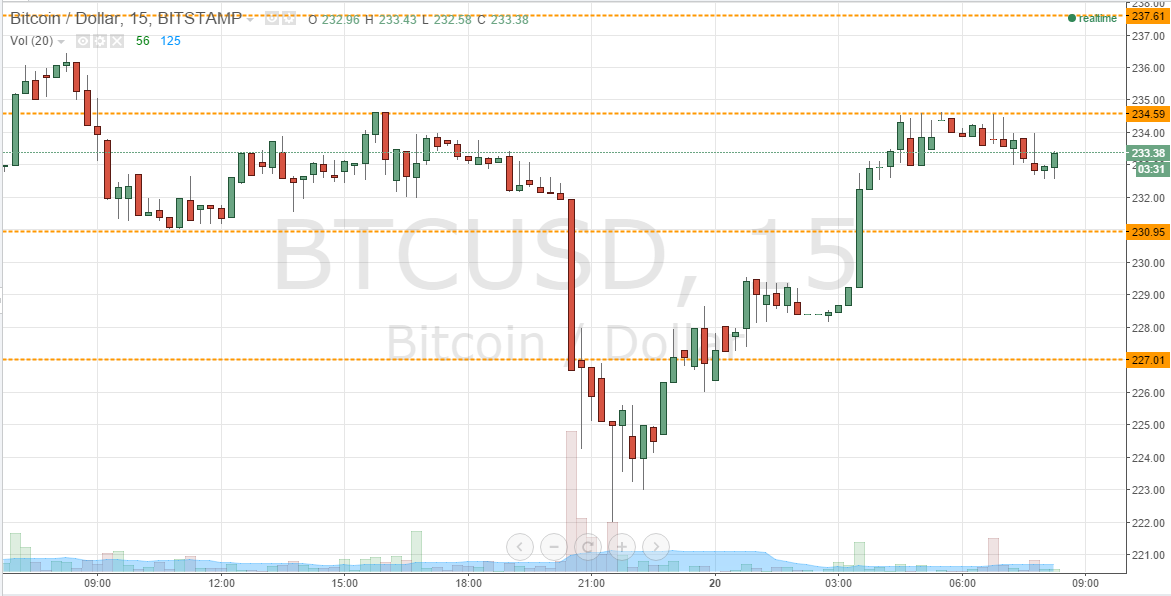
Finally, during the overnight Asian session, we saw some temporary reprieve in the steep decline we have seen in the bitcoin price over the last few days. Yesterday’s momentum brought us to trade just shy of 230 level, and overnight, we broke through this level on the intraday charts and topped out around 234.59 – pretty close one currently trade. Now we are finally seeing some action, it may be the time to set up against further volatility during today’s European session. Over the last week or so Europe has been pretty full of consolidation, but if we can break out of this trend, there may be some movement today we can take advantage of and draw profit with from the market. So, with this said, what are the levels that were keeping an eye on, and where will we look to get in and out of the markets according to our strategy? Take a quick look at the chart.

As you see, and as we already mentioned, highs for the day sit at 234.59 – this level now serves as in term resistance for the European session. 230.95 gives us in term support for today. We are looking at some pretty tight trading today, so we will initially look for a break above 234.59 to validate 237.61 as a short-term upside target. On this trade, a stop loss somewhere around 233 (just above current levels) will help us to maintain a positive risk reward profile without keeping things too tight.
Looking the other way, if we run down towards in term support, a close below this level on the intraday chart to validate 227 flat to the downside medium-term. Again, this is quite a tight trade, but a stop loss somewhere around 232 flat will leave us just enough room to define our risk while still keeping things attractive from a risk management perspective.
Charts courtesy of Trading View


