
Reason to trust
How Our News is Made
Strict editorial policy that focuses on accuracy, relevance, and impartiality
Ad discliamer
Morbi pretium leo et nisl aliquam mollis. Quisque arcu lorem, ultricies quis pellentesque nec, ullamcorper eu odio.
Bitcoin is up more than 2% today and it is trading above $9,500 against the US Dollar. BTC is trading in a positive zone and it could rally above the $9,800 and $10,000 resistance levels.
- Bitcoin is showing a lot of positive signs above the $9,500 pivot level.
- The price recovered nicely after a short term downside correction towards the $9,200 zone.
- There was a break above a key bearish trend line with resistance near $9,570 on the 4-hours chart of the BTC/USD pair (data feed from Kraken).
- The pair is likely to accelerate higher above the $9,800 as long as it is above the $9,300 support.
Bitcoin Remains In Uptrend
This past week, bitcoin popped higher and broke the $9,300 resistance area against the US Dollar. BTC price traded with a positive bias and settled above the $9,300 level and the 100 simple moving average (4-hours).
There was a minor downside correction from the $9,600 zone, but the same $9,300 area acted as a support. The price remained stable and traded above the 61.8% Fib retracement level of the key decline from the $9,943 high to $8,650 low.
Moreover, there was a break above a key bearish trend line with resistance near $9,570 on the 4-hours chart of the BTC/USD pair. Bitcoin is now trading nicely above the 76.4% Fib retracement level of the key decline from the $9,943 high to $8,650 low.
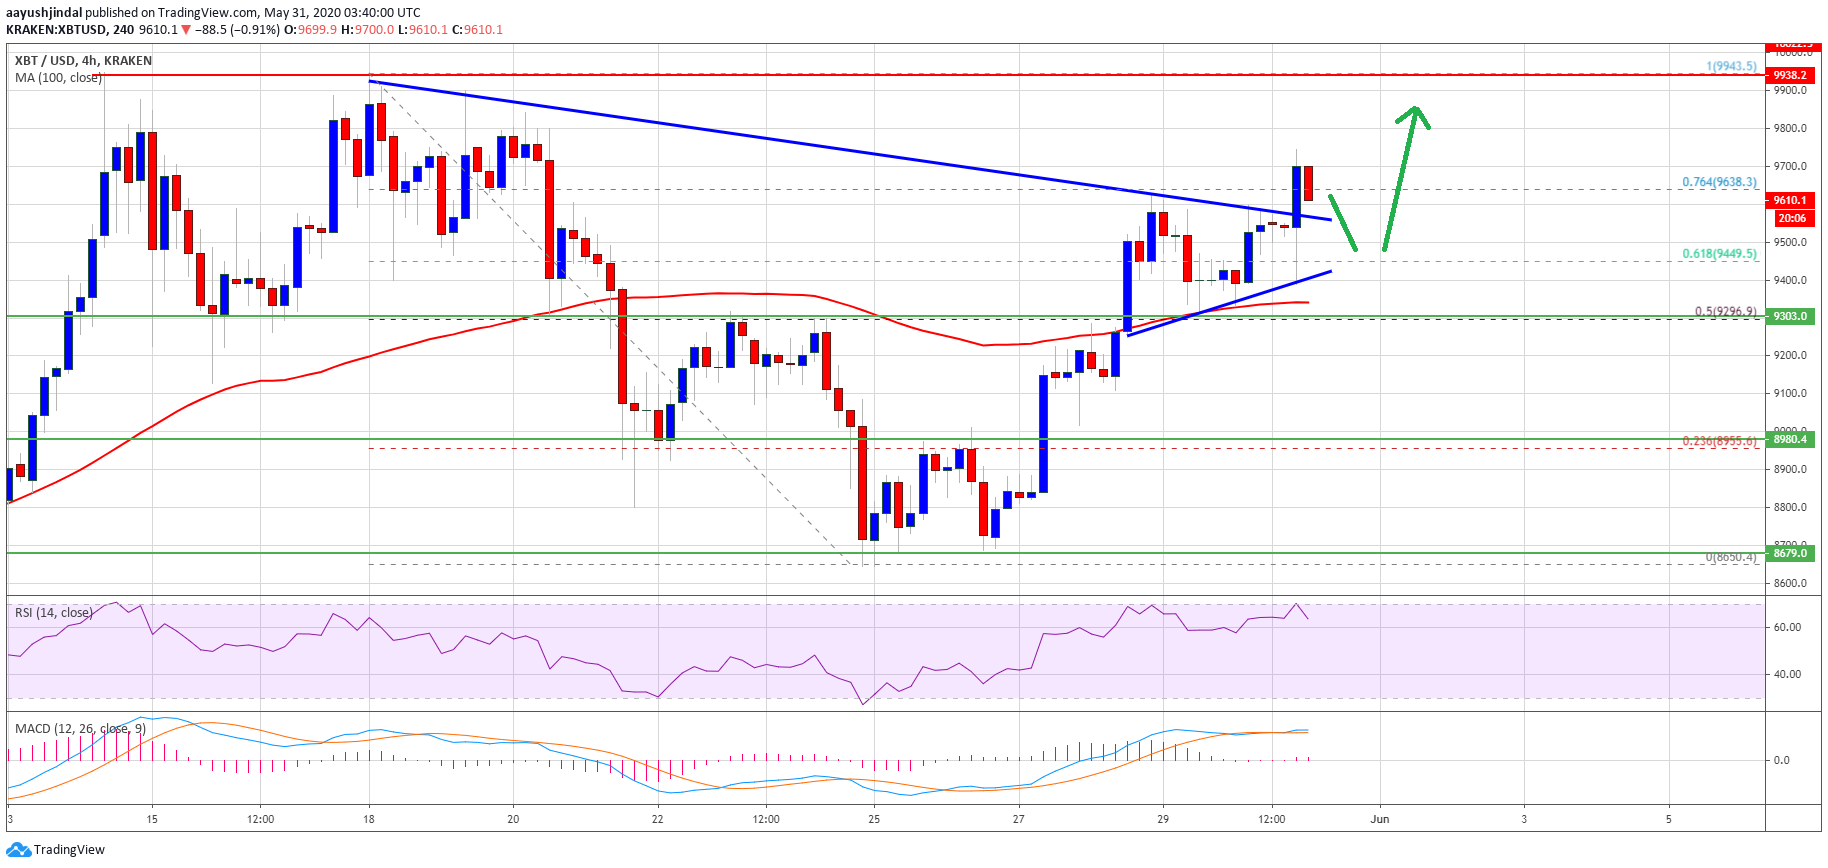
It seems like the price is likely to continue higher towards the $9,750 and $9,800 levels. The first major resistance is near the $9,950 and $10,000 levels. The next major hurdle for the bulls is near the $10,500 level, above which the price is likely to surge higher towards the $11,200 and $11,500 levels.
Dips Supported in BTC
In the short term, bitcoin price might correct lower below $9,600. An initial support is near the broken trend line or $9,580. The first key support is near the $9,430 level and a connecting bullish trend line on the same chart.
The main support is forming near the $9,300 level and the 100 simple moving average (4-hours). Any further losses may perhaps start a major decrease and the price might revisit the $9,000 level or $8,800.
Technical indicators
4 hours MACD – The MACD for BTC/USD is gaining pace in the bullish zone.
4 hours RSI (Relative Strength Index) – The RSI for BTC/USD is currently well above the 60 level.
Major Support Level – $9,300
Major Resistance Level – $9,950
Take advantage of the trading opportunities with Plus500
Risk disclaimer: 76.4% of retail CFD accounts lose money.


