Reason to trust
How Our News is Made
Strict editorial policy that focuses on accuracy, relevance, and impartiality
Ad discliamer
Morbi pretium leo et nisl aliquam mollis. Quisque arcu lorem, ultricies quis pellentesque nec, ullamcorper eu odio.
Key Points
- Bitcoin gold price tested the $225 support and is currently moving higher against the US Dollar.
- There was a break above a major bearish trend line with resistance at $242 on the hourly chart of BTG/USD (data feed from Bitfinex).
- The pair might continue to move higher towards the $280 level in the near term.
Bitcoin gold price moved above the $240 resistance against the US Dollar. BTG/USD may soon grind higher above the 100 hourly simple moving average and $260.
Bitcoin Gold Price Trend
There was a slow and steady decline in bitcoin gold price towards the $220 level against the US Dollar. The price traded as low as $225 and later formed a base for an upside move. It started an upside move and traded above the 23.6% Fib retracement level of the last drop from the $295 high to $225 low. During the upside move, there was also a break above a major bearish trend line with resistance at $242 on the hourly chart of BTG/USD.
The pair gained pace and was able to move above the $250 resistance. At the moment, the price is trading near the 50% Fib retracement level of the last drop from the $295 high to $225 low. A break above the $260 resistance and the 100 hourly simple moving average is needed for buyers to gain traction. Once there is a break above the $260 resistance, the price could accelerate above the $280 and $290 levels. The mentioned $290 level is the next major hurdle for buyers.
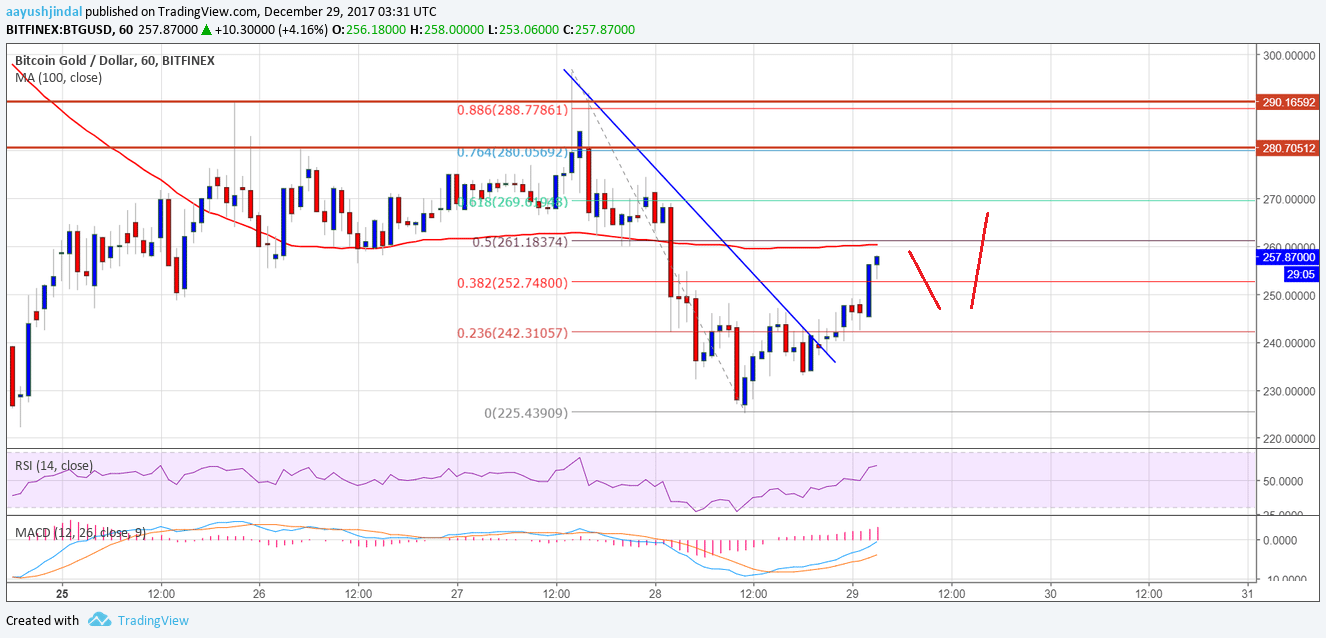
On the downside, the $240 level is an initial support. However, the most important support on the downside sits near the $225 swing low.
Looking at the technical indicators:
Hourly MACD – The MACD for BTG/USD is now placed nicely in the bullish zone.
Hourly RSI (Relative Strength Index) – The RSI for BTG/USD is moving higher above the 50 level.
Major Support Level – $240
Major Resistance Level – $290
Charts courtesy – Trading View, Bitfinex


