
Reason to trust
How Our News is Made
Strict editorial policy that focuses on accuracy, relevance, and impartiality
Ad discliamer
Morbi pretium leo et nisl aliquam mollis. Quisque arcu lorem, ultricies quis pellentesque nec, ullamcorper eu odio.
Bitcoin started a fresh decline below the $43,000 support against the US Dollar. BTC declined sharply to $40,000 and might continue to move down.
- Bitcoin started a fresh decline below the $43,000 and $42,500 support levels.
- The price is trading below $42,000 and the 100 hourly simple moving average.
- There was a break below a major bullish trend line with support near $43,600 on the hourly chart of the BTC/USD pair (data feed from Kraken).
- The pair could correct higher, but upsides might be limited above $42,000.
Bitcoin Price Turns Red
Bitcoin price failed to stay above the $43,180 support level and extended decline. BTC traded below the $42,500 support level to enter a bearish zone.
The decline gained pace below the $42,000 level and the 100 hourly simple moving average. Besides, there was a break below a major bullish trend line with support near $43,600 on the hourly chart of the BTC/USD pair. The pair even broke the $40,500 support and traded as low as $40,100.
It is now consolidating losses below the $41,000 level. On the upside, an initial resistance is near the $41,000 level. It is near the 23.6% Fib retracement level of the recent dive from the $44,375 swing high to $40,100 low.
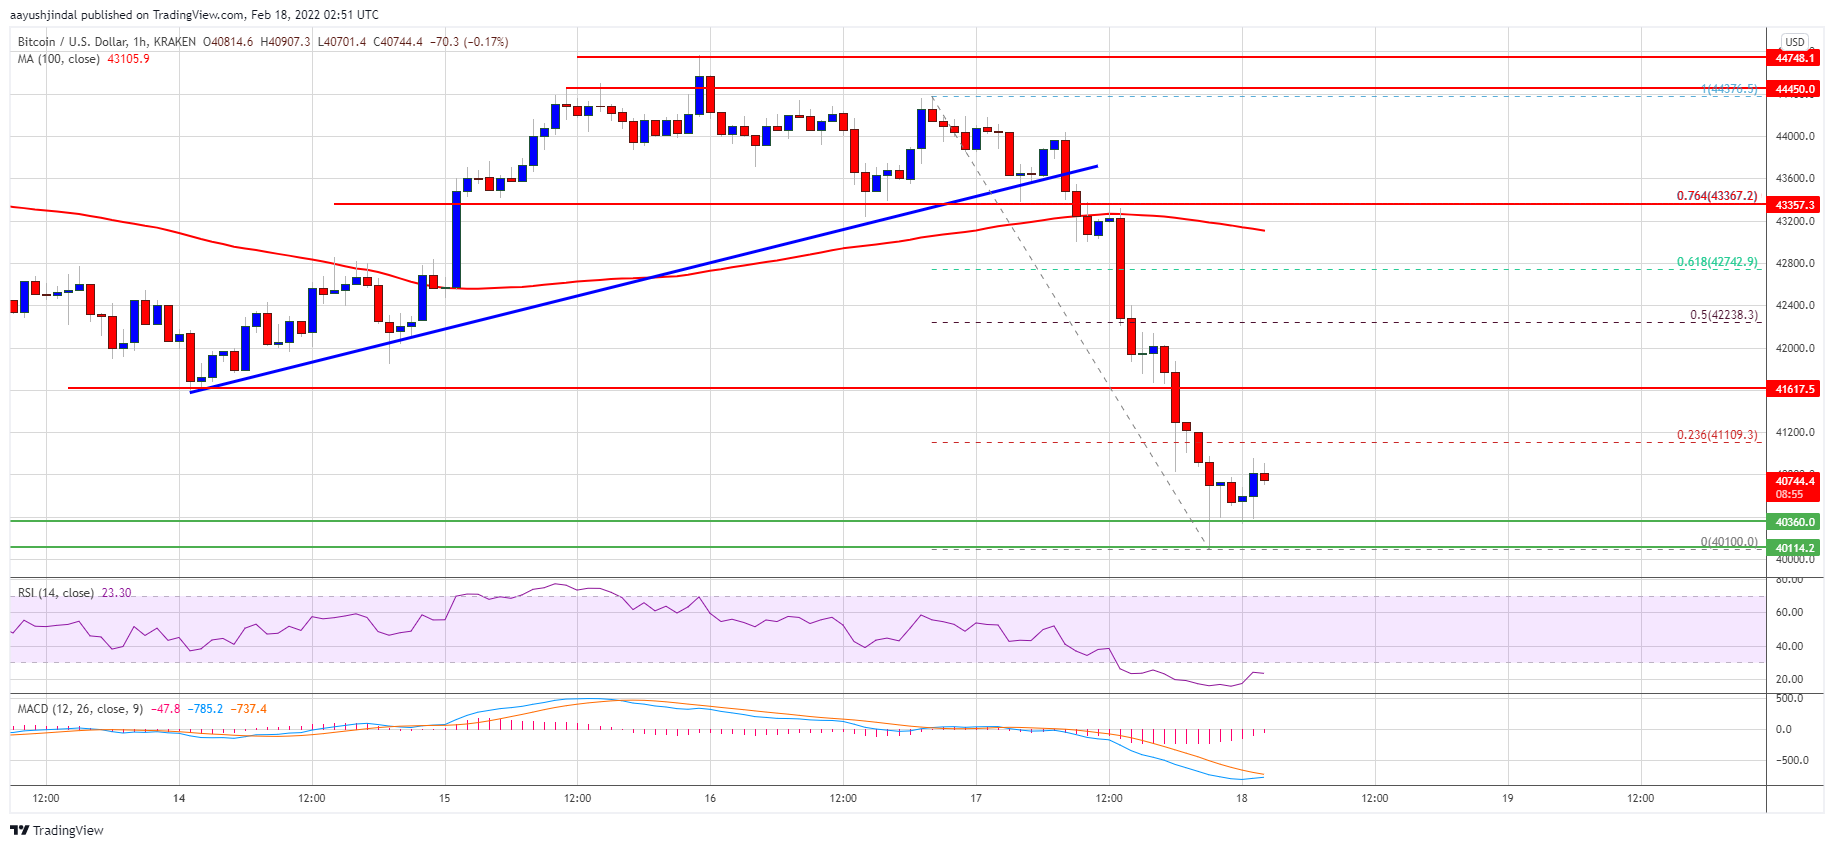
Source: BTCUSD on TradingView.com
The next key resistance is near the $41,620 level. The main resistance is now forming near the $42,250 level. It is close to the 50% Fib retracement level of the recent dive from the $44,375 swing high to $40,100 low. A clear move above the $42,250 resistance zone might start a decent increase. The next major resistance is near $42,750, above which the price might rise towards the $43,200 level.
More Losses in BTC?
If bitcoin fails to start a recovery wave above the $41,000 resistance zone, it could continue to move down. An immediate support on the downside is near the $40,350 zone.
The next major support is seen near the $40,000 level. If there is a downside break below the $40,000 support zone, the price might gain bearish momentum for a move to $38,800.
Technical indicators:
Hourly MACD – The MACD is now losing pace in the bearish zone.
Hourly RSI (Relative Strength Index) – The RSI for BTC/USD is well below the 50 level.
Major Support Levels – $40,350, followed by $40,000.
Major Resistance Levels – $41,000, $41,650 and $42,250.


