
Reason to trust
How Our News is Made
Strict editorial policy that focuses on accuracy, relevance, and impartiality
Ad discliamer
Morbi pretium leo et nisl aliquam mollis. Quisque arcu lorem, ultricies quis pellentesque nec, ullamcorper eu odio.
- Bitcoin has come closer to forming a dreaded Wall Street chart pattern: the Death Cross.
- The bearish technical indicator materializes when an asset’s long-term moving average crosses above its short-term moving average.
- Its occurrence on Bitcoin daily chart in March 2020 led to a 55 percent price crash.
A “death cross” pattern is looking to materialize on Bitcoin’s daily price chart once again.
So it appears, the cryptocurrency’s 20-day exponential moving average (20-DMA) is hinting to close below its 50-day simple moving average (50-DMA) in the coming sessions. The formation would mark Bitcoin’s first 20-50 crossover since March 2020.
Why 20-50 Death Cross?
A Death Cross pattern typically indicates the possibility of a significant sell-off. Traders for decades have used the technical indicator to predict some of the most severe bearish markets, including the 2008-09 financial crisis, and the dotcom bubble.
Chart watchers confirm a Death cross pattern typically when a 50-day moving average closes above a 200-day moving average. Nevertheless, the 50-200 crossovers generally are lagging indicators – they appear after an asset undergoes major downside moves.
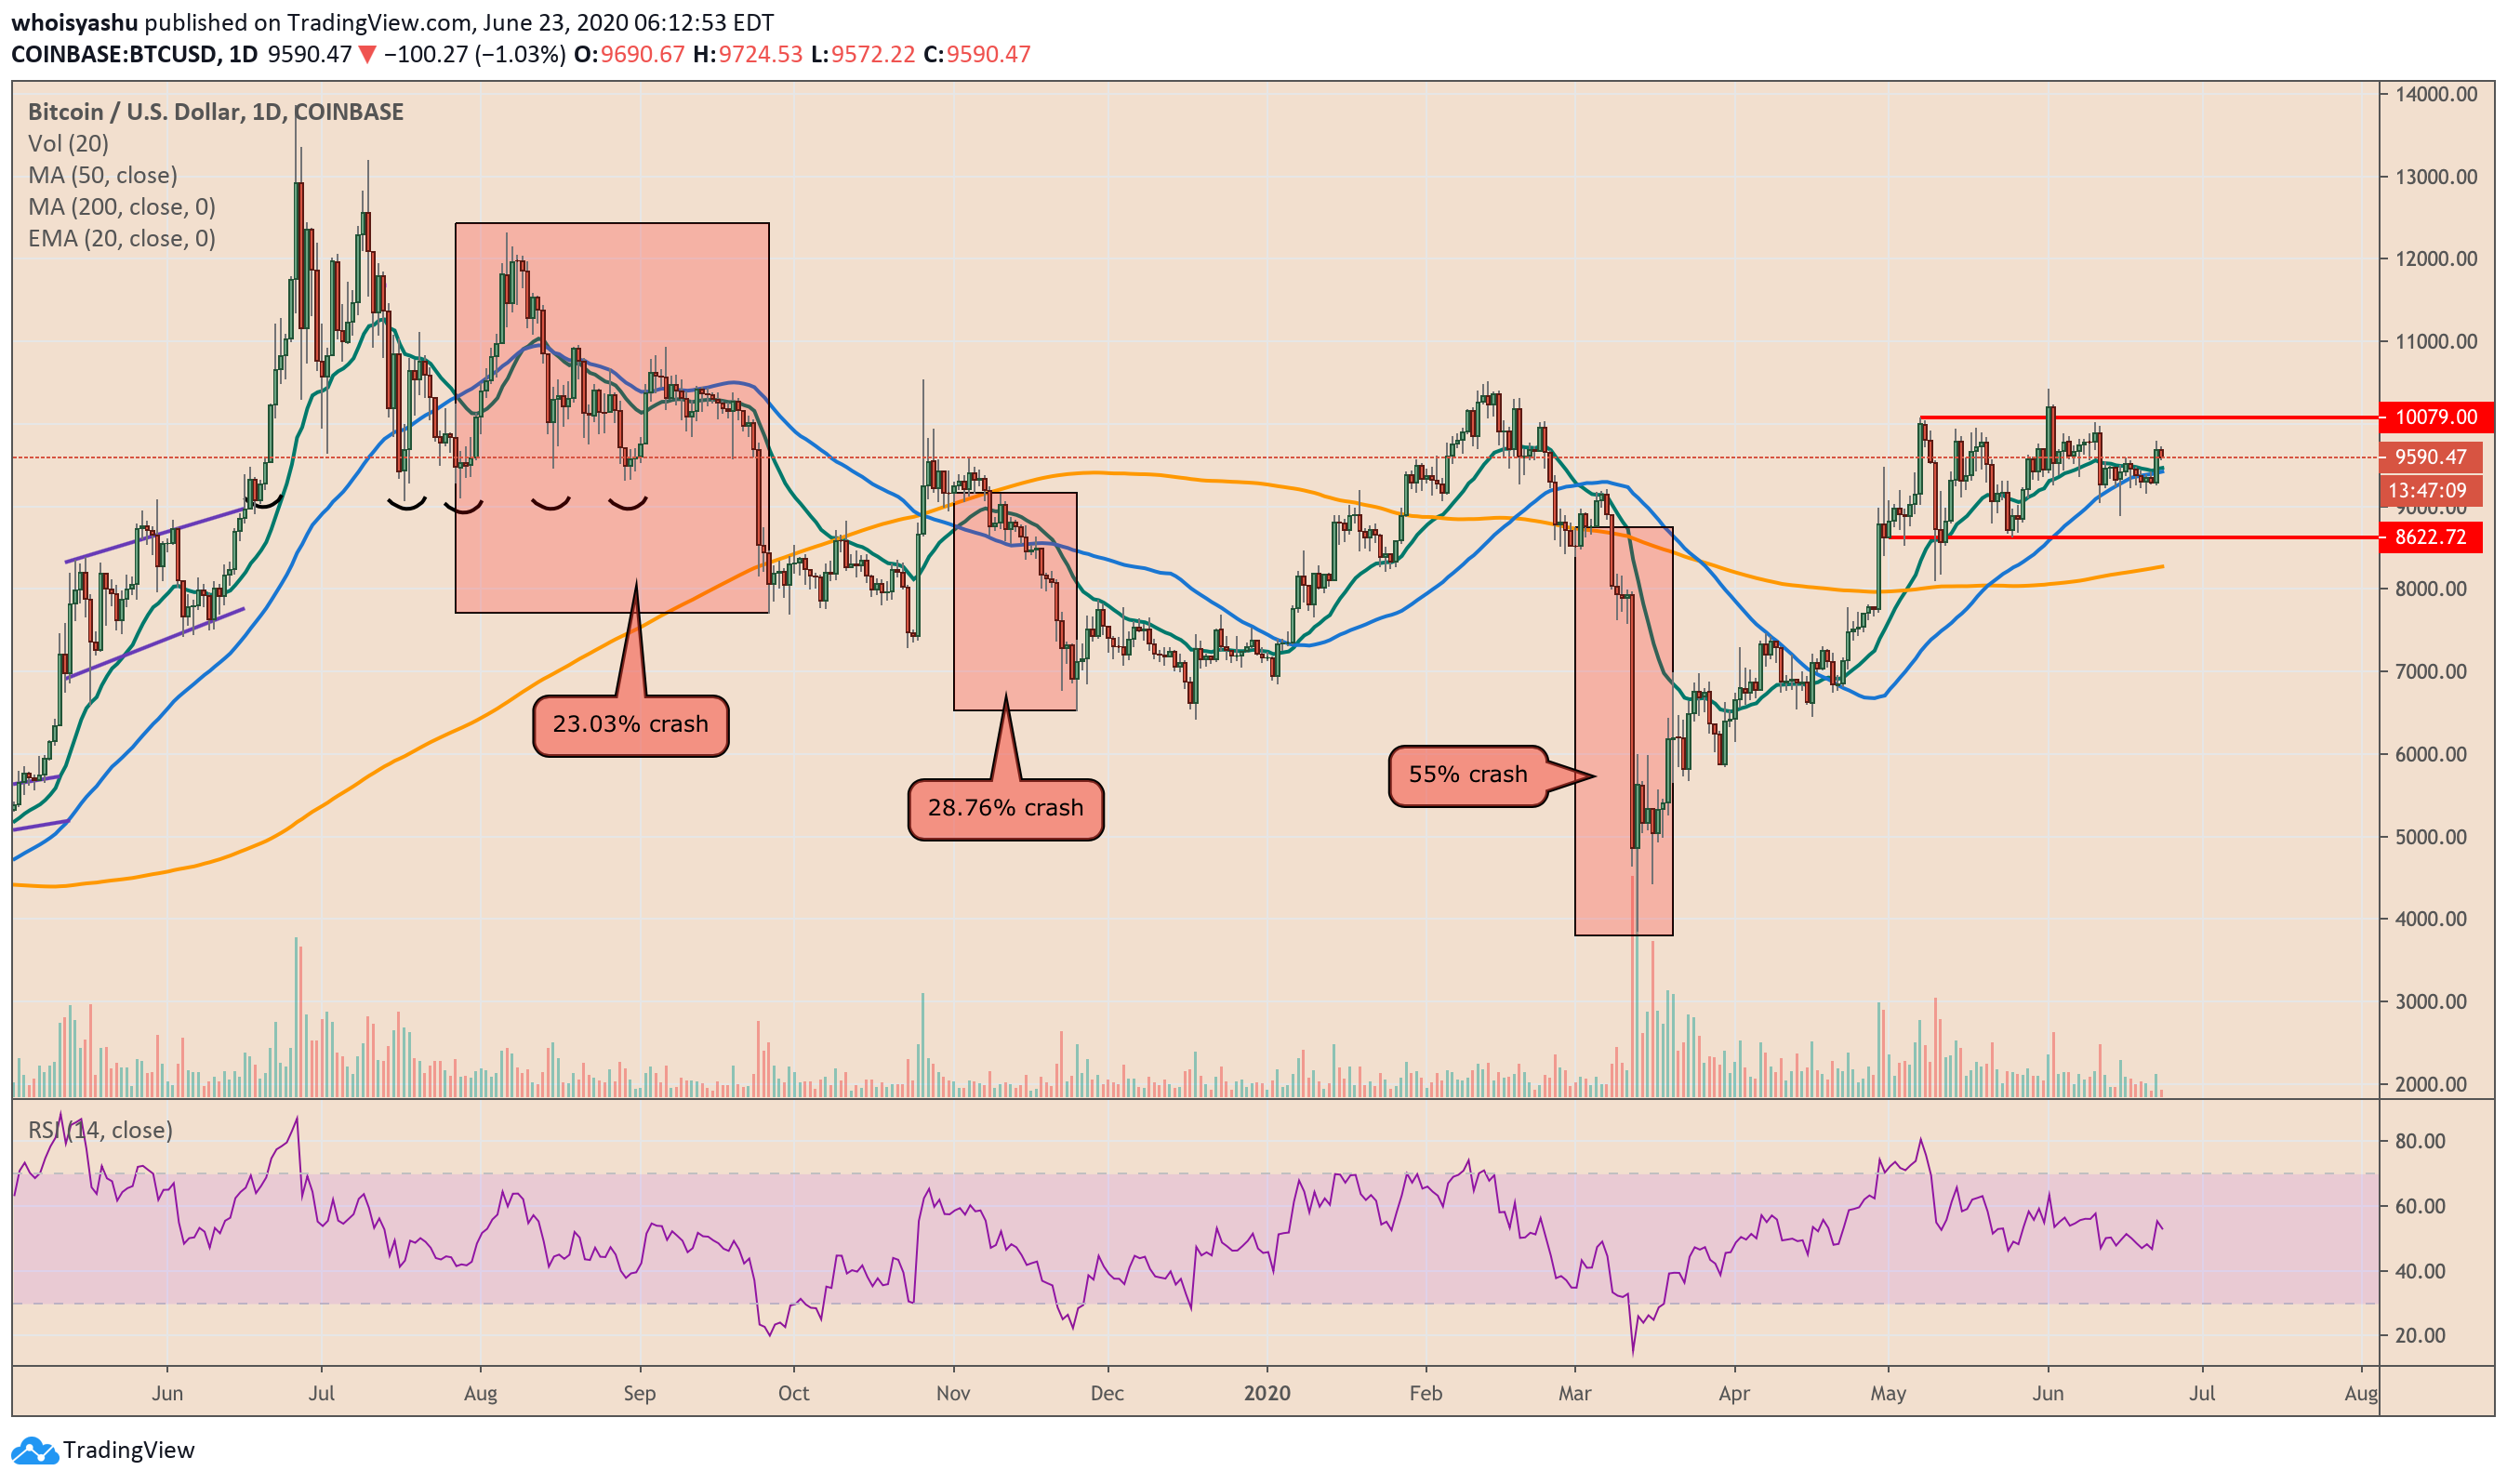
Bitcoin price chart on TradingView.com showing its recent 20-50 Death Crosses. Source: TradingView.com
Using a 20-50 crossover allows traders to predict an asset’s trend in real-time. The Death Cross’s last appearance on the Bitcoin chart, for instance, led to an immediate downside correction of 55 percent.
The same happened following the 20-50 crossover in November 2019. The bitcoin price crashed by as much as 28.76 percent shortly after painting a Death Cross pattern. Meanwhile, an uncanny fractal from July 2019 also resulted in a downside price correction of 23.03 percent.
The eerily similar outcomes point to the same bearish moves in the Bitcoin market as its next 20-50 Death Cross materializes.
A Golden Cross on Bitcoin Weekly Chart
There is a massive likelihood of Bitcoin heading lower towards or below $9,000 on the daily chart’s Death Cross sentiment. Nevertheless, the downside move may not last for an extended period as a dissenting Golden Cross forms on Bitcoin’s weekly charts.
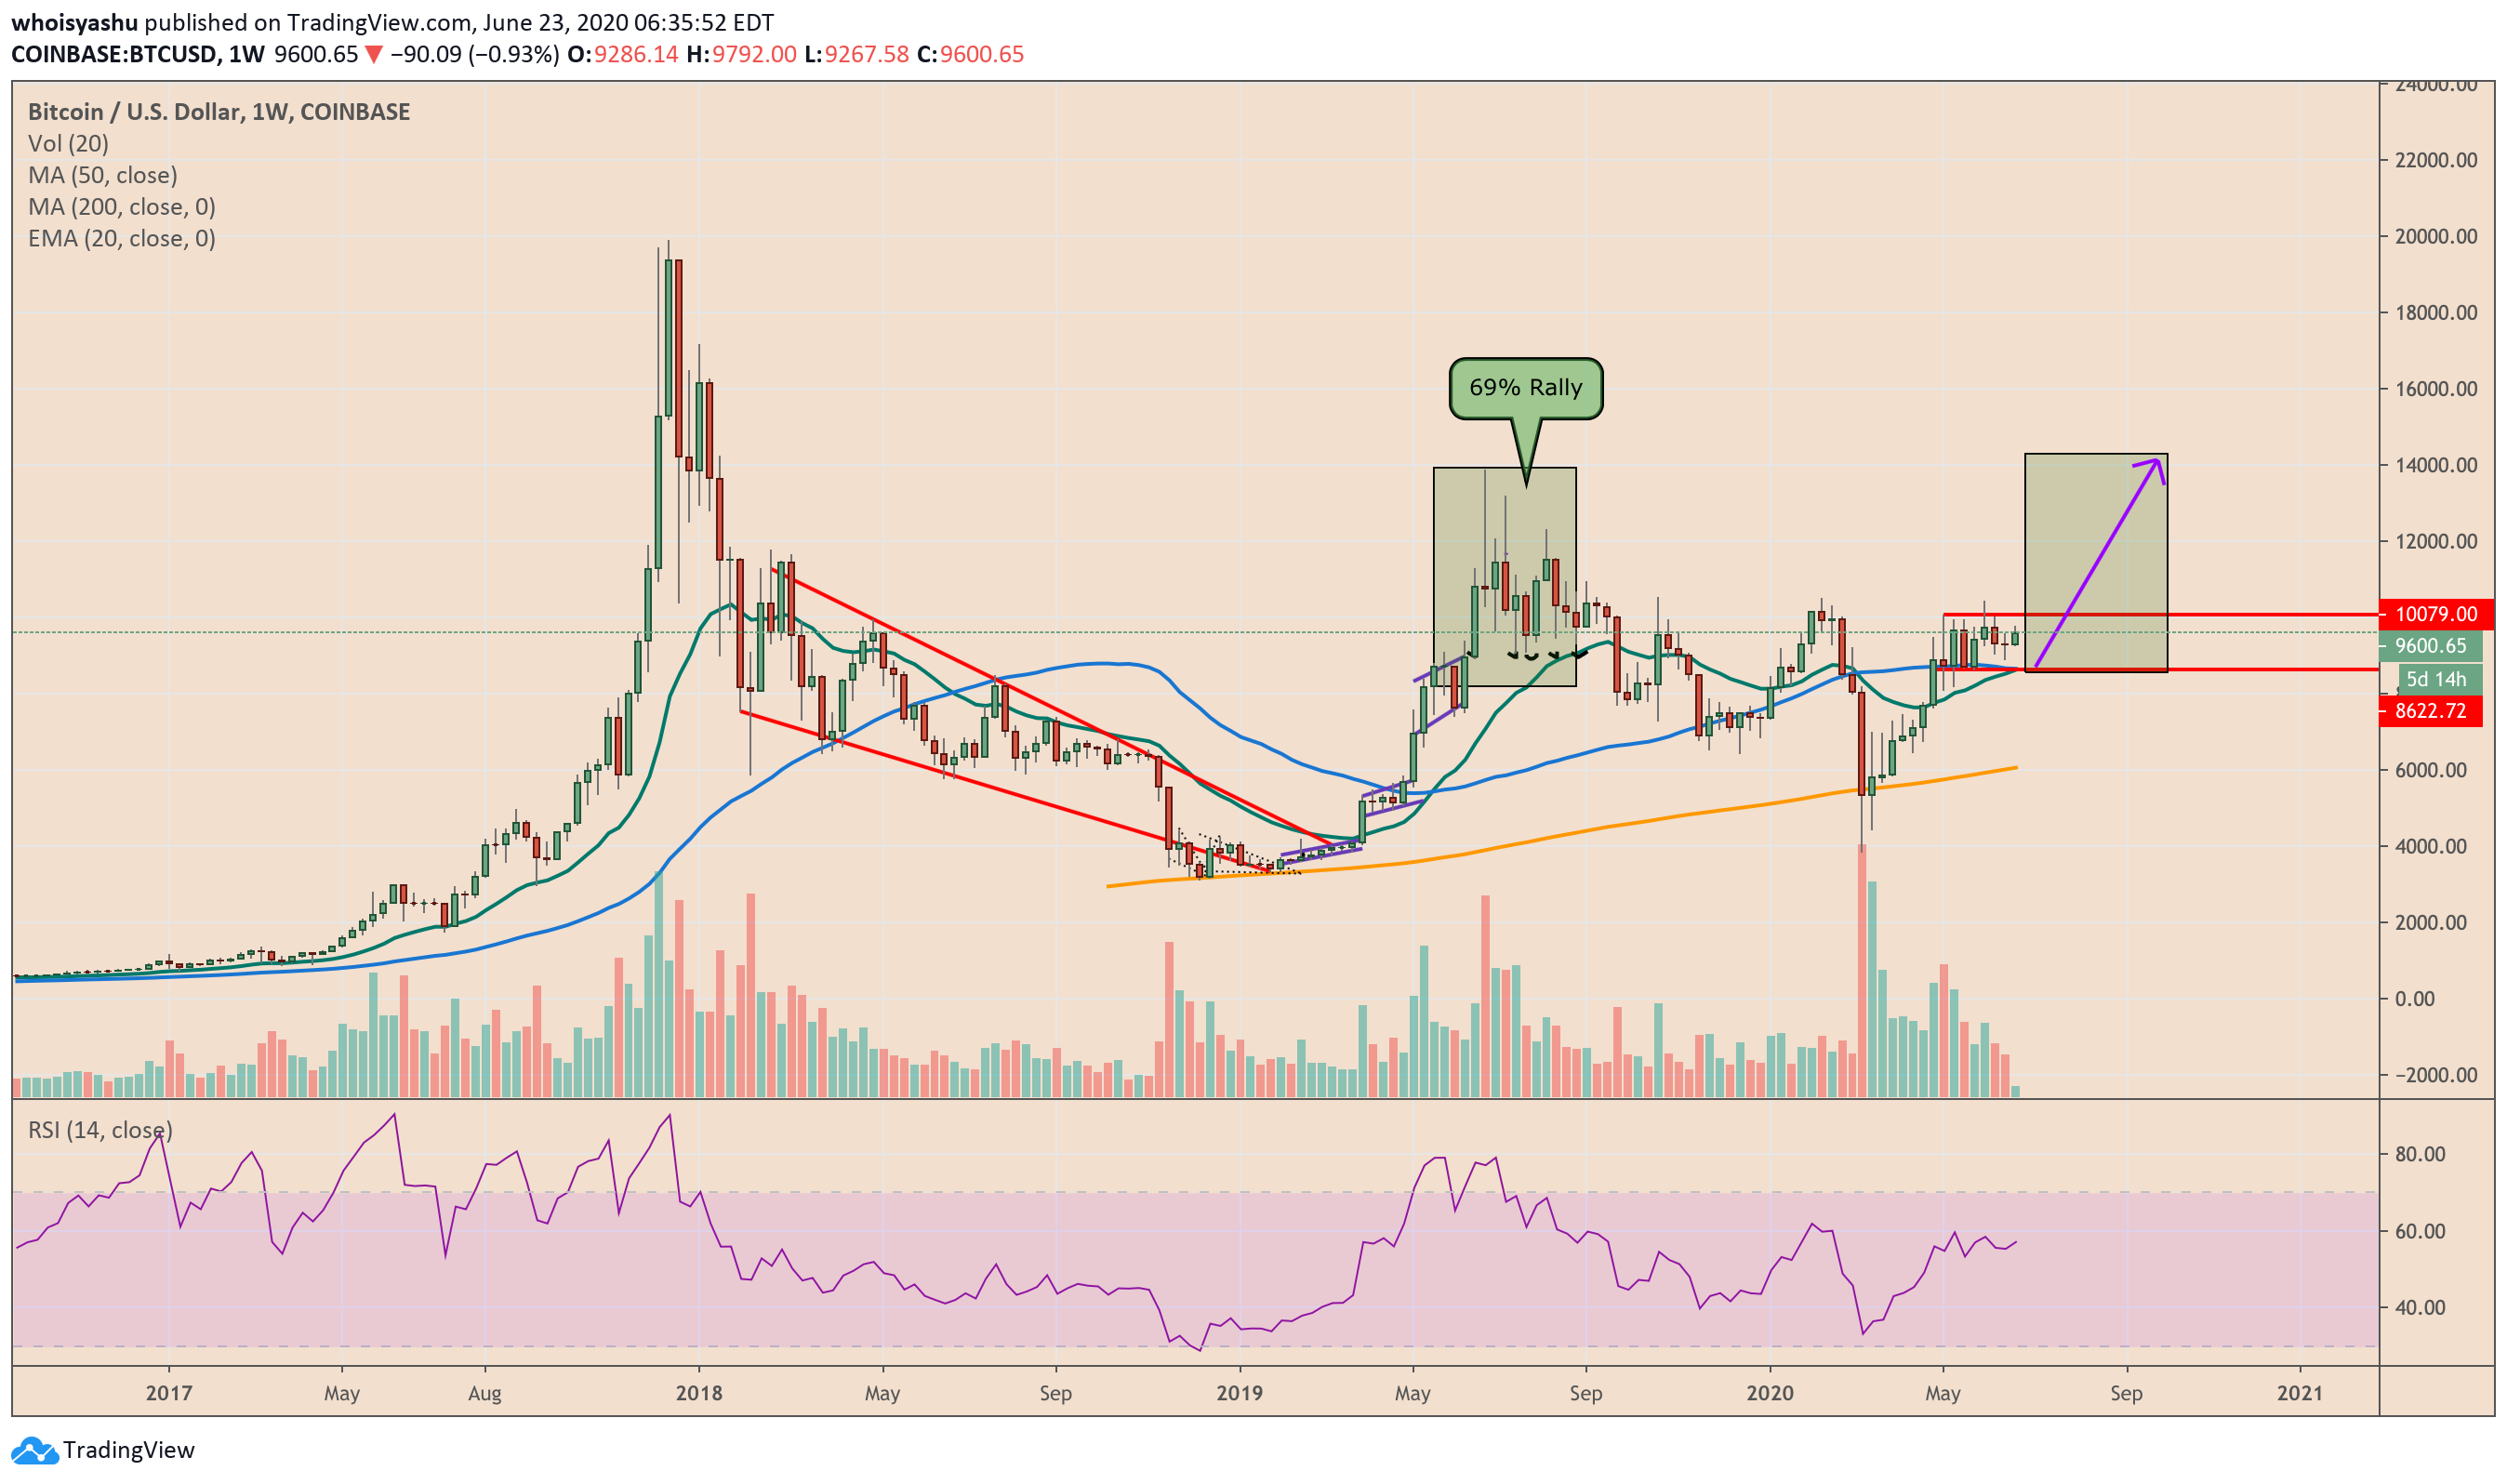
Bitcoin price chart on TradingView.com showing its upcoming 20-50 Golden Cross formation. Source: TradingView.com
A Golden Cross is a polar opposite of a Death Cross. The pattern surfaces when an asset’s short-term moving average closes above its long-term moving average. Bitcoin is less than $40 away from painting the 20-50 bullish crossover on its weekly chart.
A fractal from mid-2019 shows that bitcoin tends to rise after a 20-50 Golden Cross formation. The cryptocurrency surged by circa 69 percent weeks after the pattern’s occurrence in May 2019.
That leaves Bitcoin in a long-term bullish bias. While it may correct lower – possibly towards its interim support target in $8,000-8,600 area, it could eventually resume its uptrend towards $10,000. That may lead to a breakout towards or above $12,000.
Charts from TradingView.com


