
Reason to trust
How Our News is Made
Strict editorial policy that focuses on accuracy, relevance, and impartiality
Ad discliamer
Morbi pretium leo et nisl aliquam mollis. Quisque arcu lorem, ultricies quis pellentesque nec, ullamcorper eu odio.
Bitcoin cash price declined and retested the $220 support zone against the US Dollar. BCH is now consolidating and facing many hurdles near $226 and $230.
- Bitcoin cash price tested the $220 support level and it is consolidating losses against the US Dollar.
- The price is currently facing a strong resistance near the $230 and $231 levels.
- There is a key bearish trend line forming with resistance near $226 on the 4-hours chart of the BCH/USD pair (data feed from Kraken).
- The pair must clear the $230 resistance zone to start a fresh upward move in the near term.
Bitcoin Cash Price Holding Main Support
This past week, bitcoin cash price started a steady decline (similar to btc) below the $235 and $230 support levels. BCH even traded below the $225 support level and settled well below the 100 simple moving average (4-hours).
It tested the $220 support and formed a low at $217. It is currently consolidating losses and correcting above the $220 level. There was a spike above the 23.6% Fib retracement level of the downward move from the $246 swing high to $217 low.
However, the price is facing a lot of hurdles on the upside, starting with $225. There is also a key bearish trend line forming with resistance near $226 on the 4-hours chart of the BCH/USD pair.
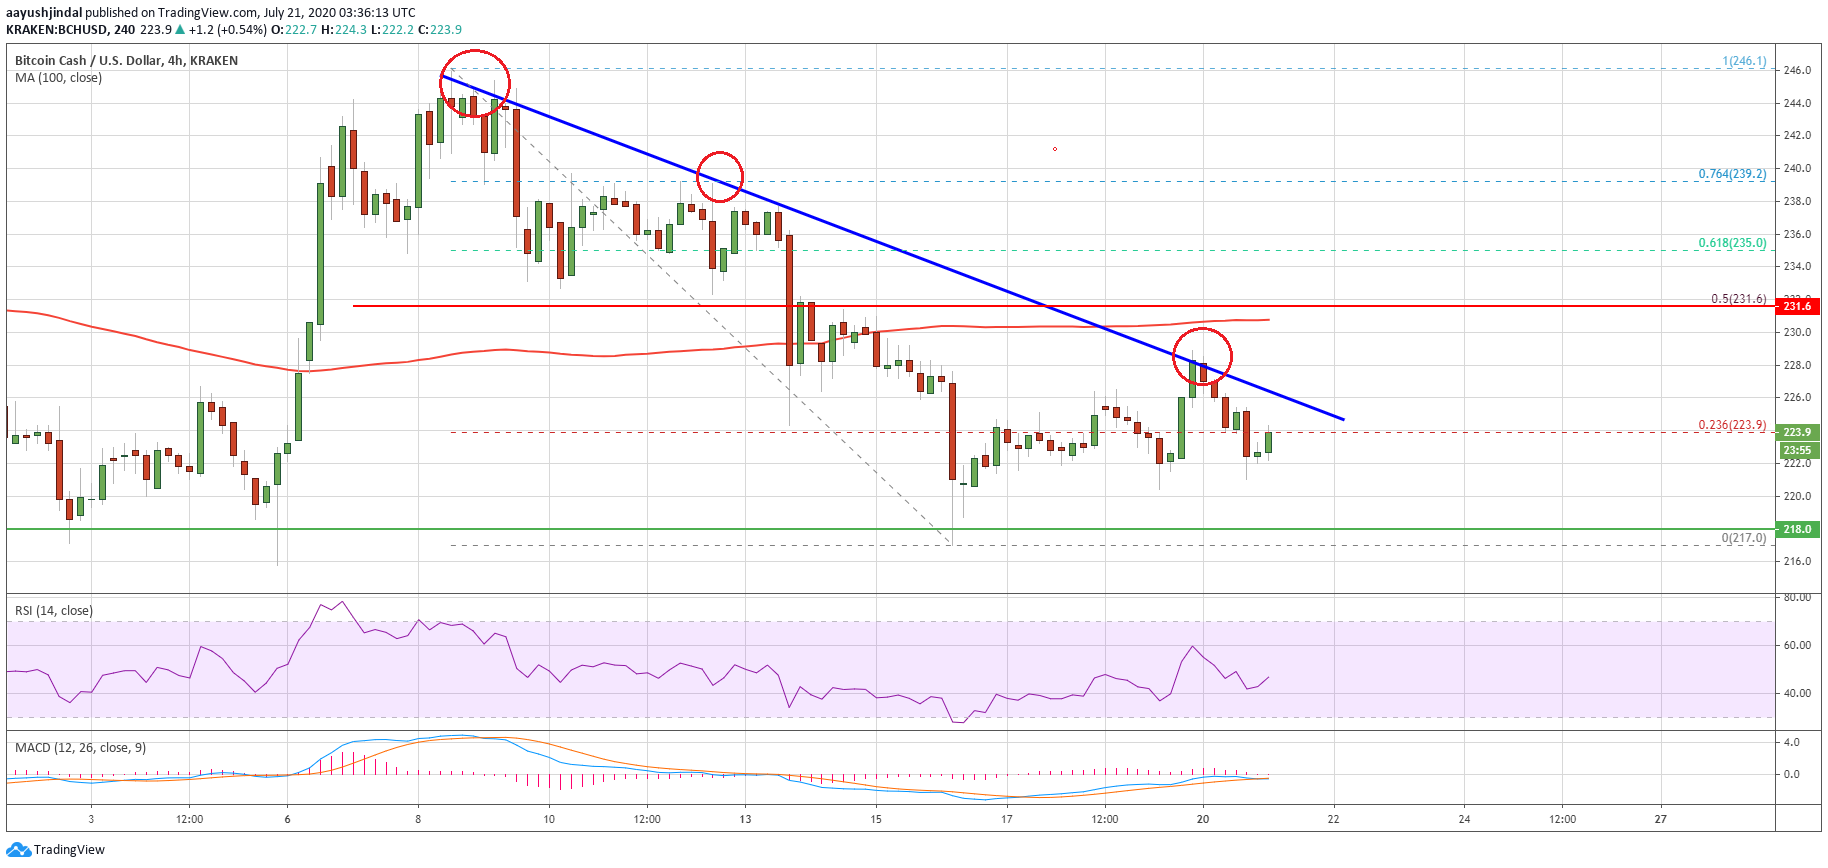
Bitcoin cash testing $225: Source: TradingView.com
The main resistance above the trend line is near the $230 level and the 100 simple moving average (4-hours). It is close to the 50% Fib retracement level of the downward move from the $246 swing high to $217 low.
A successful break above the trend line and then $230 could initiate a fresh increase. In the mentioned case, the bulls are likely to aim a retest of $245. Any further gains could push the price above the $250 resistance.
Bearish Break in BCH?
If bitcoin cash price fails to break the trend line resistance, $230, and the 100 simple moving average (4-hours), there is a risk of a major downside break.
An initial support is near the $220 level, below which the price could even trade below the $217 low. Any further losses may perhaps lead the price towards the $200 handle in the near term.
Technical indicators
Hourly MACD – The MACD for BCH/USD is now losing pace in the bullish zone.
Hourly RSI (Relative Strength Index) – The RSI for BCH/USD is currently rising towards the 50 level.
Key Support Levels – $220 and $217.
Key Resistance Levels – $226 and $230.


