
Reason to trust
How Our News is Made
Strict editorial policy that focuses on accuracy, relevance, and impartiality
Ad discliamer
Morbi pretium leo et nisl aliquam mollis. Quisque arcu lorem, ultricies quis pellentesque nec, ullamcorper eu odio.
Bitcoin cash price rallied over 6% and it broke the $230 and $235 resistance levels against the US Dollar. BCH is likely to continue higher towards $250 if it clears the 100 SMA (H4).
- Bitcoin cash price is gaining momentum above the $235 resistance level against the US Dollar.
- The price is currently facing hurdles near $240 and the 100 simple moving average (4-hours).
- There was a break above a key contracting triangle with resistance near $233 on the 4-hours chart of the BCH/USD pair (data feed from Kraken).
- The pair is likely to accelerate further higher if it clears the 100 SMA and $240.
Bitcoin Cash Price Rallies 6%
After forming a support base above the $220 level, bitcoin cash price started a steady recovery. BCH broke the $220 and $230 resistance levels to move into a positive zone, similar to bitcoin above $10,500.
The price traded above the 23.6% Fib retracement level of the downward move from the $297 high to $200 swing low. There was also a break above a key contracting triangle with resistance near $233 on the 4-hours chart of the BCH/USD pair.
The pair is now facing hurdles near $240 and the 100 simple moving average (4-hours). The current price action is positive and if bitcoin cash clears the 100 SMA, there are chances of another push towards the $250 resistance.
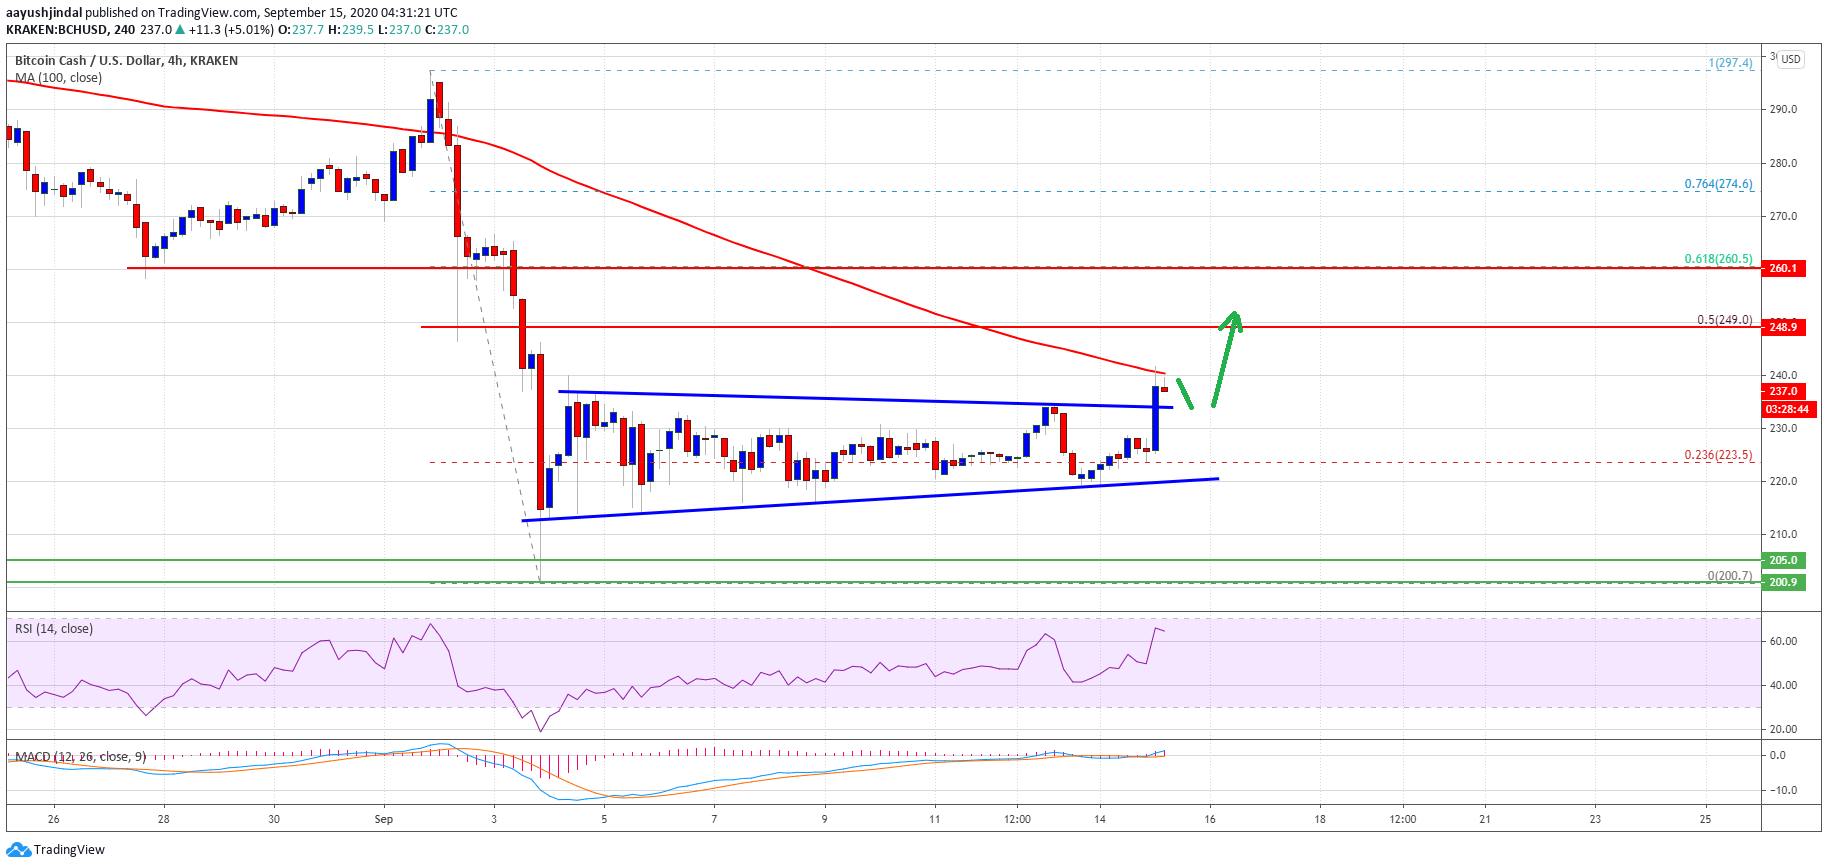
Bitcoin cash rallies to $240: Source: TradingView.com
The 50% Fib retracement level of the downward move from the $297 high to $200 swing low is near the $250 level to act as a resistance. Any further gains could lead the price towards the $260 and $265 resistance levels in the near term. The next major hurdle is near the $290 swing high.
Dips Supported in BCH?
If bitcoin cash price starts a downside correction, the broken triangle resistance near $234 might provide support. The next major support is near the $230 level, where the bulls are likely to appear.
If the price fails to stay above the $230 support, the price could revisit the $220 support. Any further losses could lead the price towards the $200 handle in the near term.
Technical indicators
Hourly MACD – The MACD for BCH/USD is currently gaining pace in the bullish zone.
Hourly RSI (Relative Strength Index) – The RSI for BCH/USD is currently rising and it is well above the 60 level.
Key Support Levels – $230 and $220.
Key Resistance Levels – $240 and $250.


