

Key Points
- Bitcoin cash price declined this past week and tested the $600 support zone against the US Dollar.
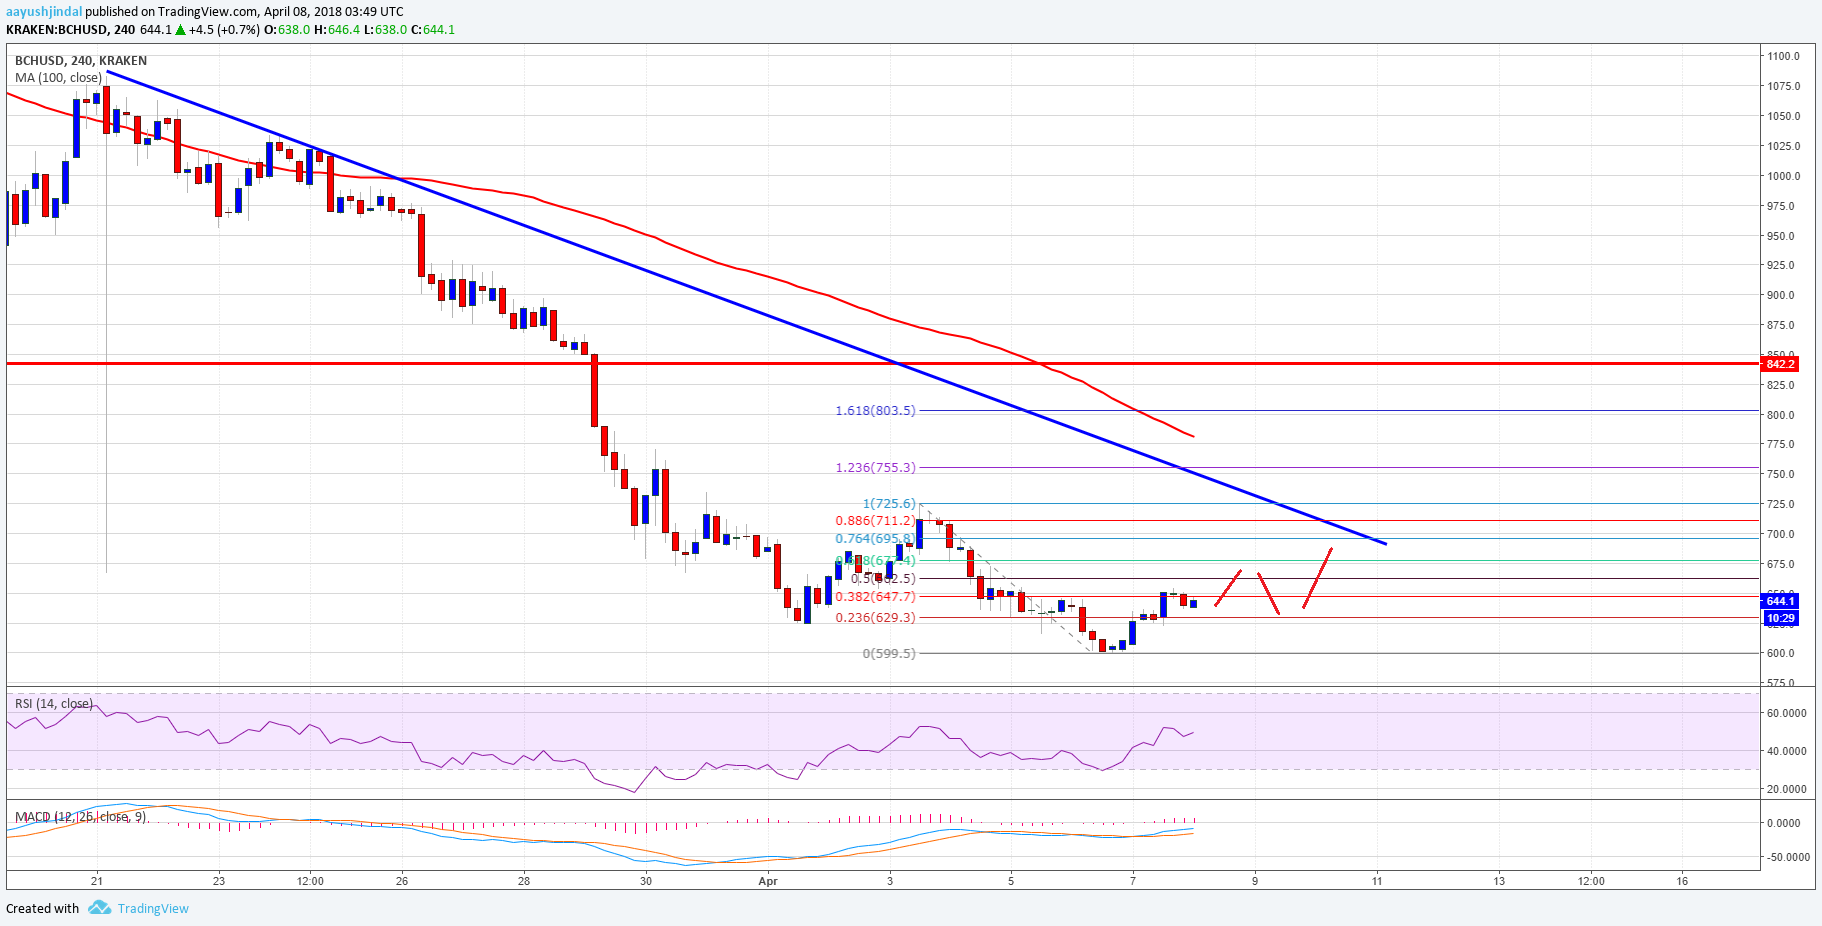
- There is a monster bearish trend line forming with resistance at $680 on the 4-hours chart of the BCH/USD pair (data feed from SimpleFX).
- The pair may continue to correct a few points higher, but it could face sellers near $680-700 in the near term.
Bitcoin cash price remains in a bearish zone below $700 against the US Dollar. BCH/USD must stay above the $600 level to start a fresh recovery.
Bitcoin Cash Price Support
There were heavy losses in bitcoin cash price this past week from well above $700 against the US Dollar. The price declined and broke a few important supports such as $680 and $650. It traded close to the $600 support and formed a low at $599.5. Later, a minor upside move was initiated and the price moved above $620. There was also a break above the 23.6% Fib retracement level of the last decline from the $725 high to $599 low.
However, there are many barriers on the upside starting with the $670 level. There is also a monster bearish trend line forming with resistance at $680 on the 4-hours chart of the BCH/USD pair. An immediate resistance is near the 50% Fib retracement level of the last decline from the $725 high to $599 low at $660. A break and close above the $660 level would call for a test of the $680-700 resistance zone. A proper break above the $700 level could move the price in a bullish zone.

On the downside, the $600 level holds a lot of importance. If the price fails to hold the $600 level, there could be more losses.
Looking at the technical indicators:
4-hours MACD – The MACD for BCH/USD is slowly moving in the bullish zone.
4-hours RSI (Relative Strength Index) – The RSI for BTC/USD is now just above the 50 level.
Major Support Level – $600
Major Resistance Level – $680
Charts courtesy – SimpleFX