
Reason to trust
How Our News is Made
Strict editorial policy that focuses on accuracy, relevance, and impartiality
Ad discliamer
Morbi pretium leo et nisl aliquam mollis. Quisque arcu lorem, ultricies quis pellentesque nec, ullamcorper eu odio.
Key Points
- Bitcoin cash price recovered recently, but it struggled to break the $1,500 resistance against the US Dollar.
- There was a break below a short-term contracting triangle pattern with support at $1,450 on the hourly chart of the BCH/USD pair (data feed from Kraken).
- The pair may decline a few points towards the $1,400 and $1,380 support levels.
Bitcoin cash price is struggling to gain momentum above $1,500 against the US Dollar. BCH/USD could decline once again if buyers lose control in the short term.
Bitcoin Cash Price Resistance
There was a decent recovery over the weekend as bitcoin cash price moved above the $1,450 resistance against the US Dollar. However, the price struggled to break the $1,500 resistance, which was also a support earlier. Moreover, the 100 hourly simple moving average, which is currently at $1,490 also acted as a major hurdle for buyers. The price is currently moving down and it broke the 23.6% Fib retracement level of the last wave from the $1,266 low to $1,505 high.
During the decline, there was a break below a short-term contracting triangle pattern with support at $1,450 on the hourly chart of the BCH/USD pair. It seems like the $1,500 barrier acted as a crucial resistance and prevented declines. It may decline further and trade towards the 50% Fib retracement level of the last wave from the $1,266 low to $1,505 high. Therefore, the next major support is around the $1,400 and $1,380 levels.
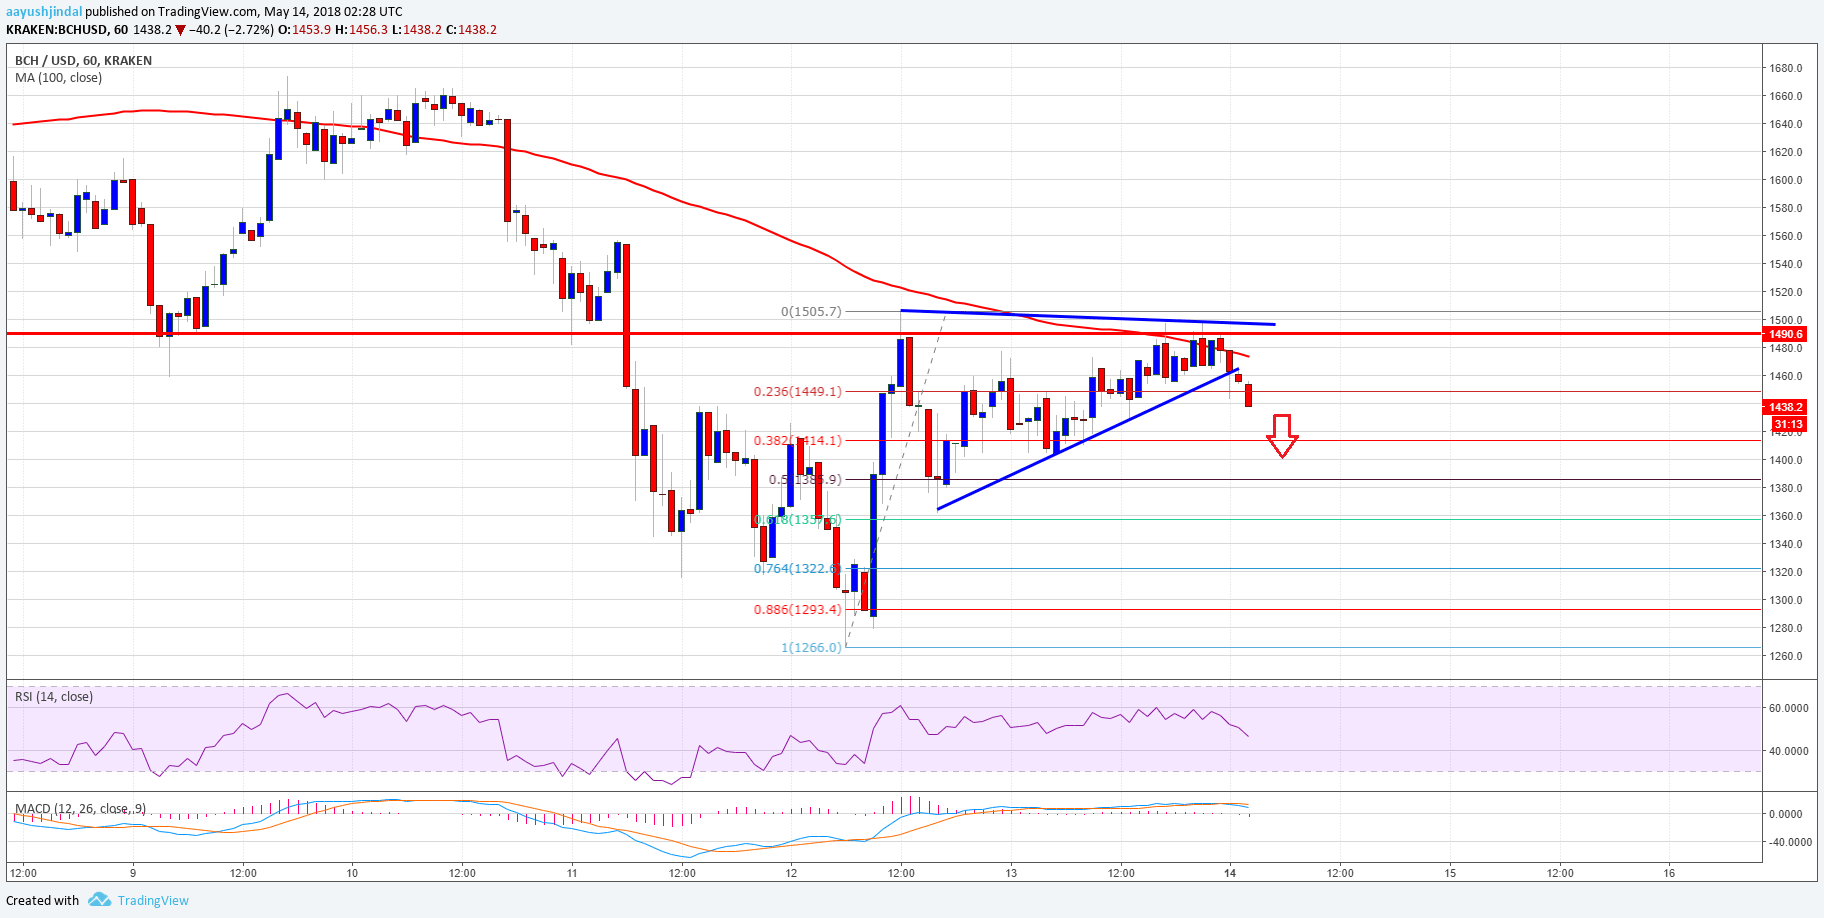
Looking at the chart, the price is currently under a minor bearish pressure below $1,480 and the 100 hourly SMA. If buyers succeed in gaining momentum above $1,500 and 100 hourly SMA, there could be more gains. The next resistance in the mentioned case could be $1,620.
Looking at the technical indicators:
Hourly MACD – The MACD for BCH/USD is slowly moving in the bearish zone.
Hourly RSI (Relative Strength Index) – The RSI for BCH/USD has just moved below the 50 level.
Major Support Level – $1,380
Major Resistance Level – $1,500


