Key Points
- Bitcoin cash price declined further and it broke the $1,000 support against the US Dollar.
- There are two bearish trend lines forming with resistance near $1,040 and $1,080 on the hourly chart of BCH/USD (data feed from SimpleFX).
- The pair may continue to move down towards the $950 and $920 levels in the near term.
Bitcoin cash price remains in a major downtrend against the US Dollar. BCH/USD remains at a risk of more losses towards the $950 and $920 levels.
Bitcoin Cash Price Resistance
There was a slight correction of around $50-100 yesterday in bitcoin cash price against the US Dollar. However, the upside move was capped by the $1,100 level. The mentioned $1,100 was a buy zone earlier and it recently prevented an upside move. The price declined once again and it even broke a major support near $1,000 to move into a bearish zone.
It traded as low as $970 and it seems like it may decline further. An initial resistance is around the 23.6% Fib retracement level of the last drop from the $1,109 high to $970 low. On the upside, there are many barriers near the $1,050 level. There are also two bearish trend lines forming with resistance near $1,040 and $1,080 on the hourly chart of BCH/USD. Furthermore, the 50% Fib retracement level of the last drop from the $1,109 high to $970 low is around $1,040.
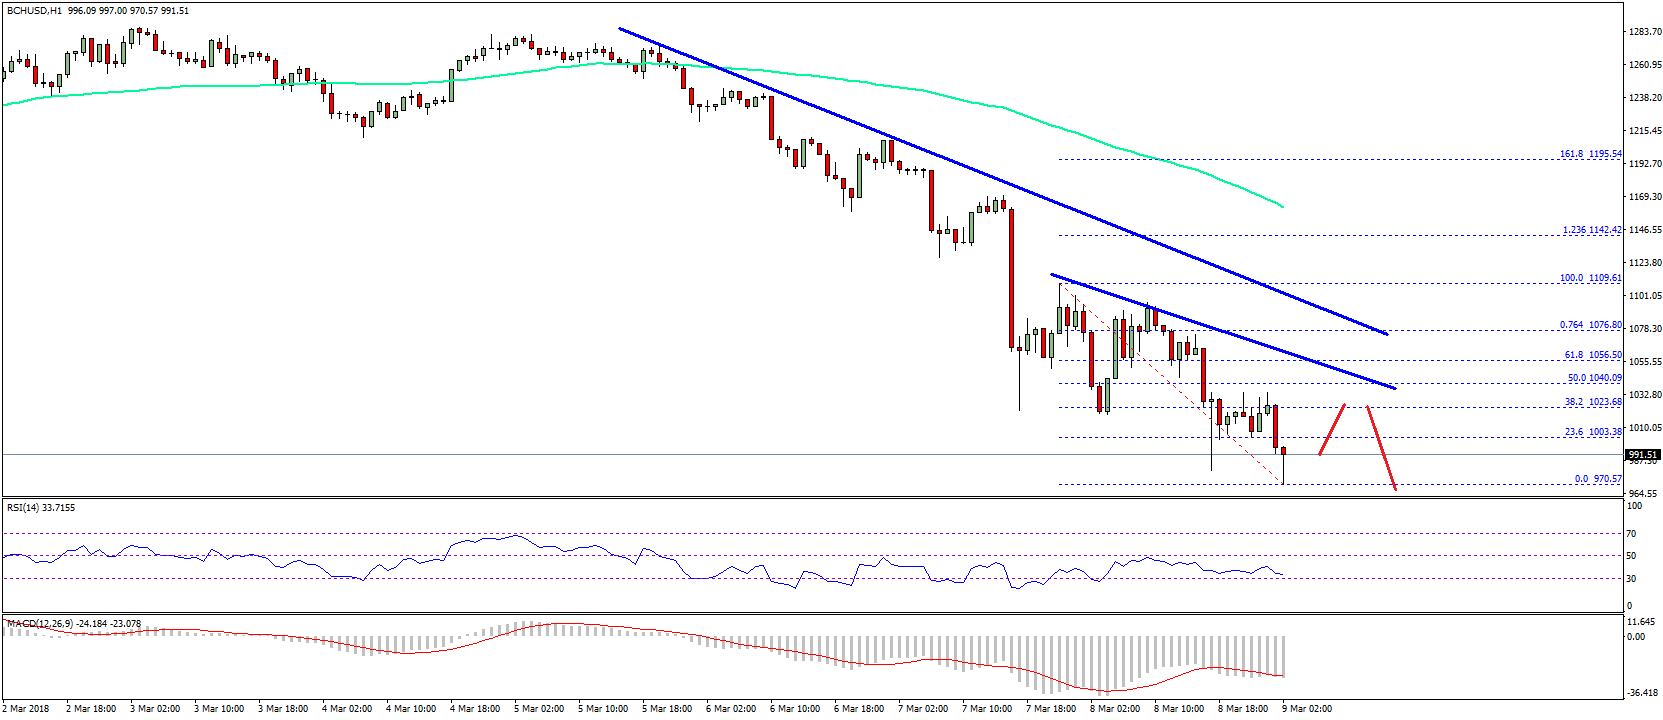

Therefore, the $1,040 level may act as a major resistance on the upside. On the downside, the price will most likely retest the last swing low of $970. A break below the stated $970 level could push the price towards the next supports near $950 and $920.
Looking at the technical indicators:
Hourly MACD – The MACD for BCH/USD is placed heavily in the bearish zone.
Hourly RSI (Relative Strength Index) – The RSI for BCH/USD is currently well below the 40 level.
Major Support Level – $950
Major Resistance Level – $1,040
Charts courtesy – SimpleFX