Reason to trust

How Our News is Made
Strict editorial policy that focuses on accuracy, relevance, and impartiality
Ad discliamer
Morbi pretium leo et nisl aliquam mollis. Quisque arcu lorem, ultricies quis pellentesque nec, ullamcorper eu odio.
CryptoQuant has revealed in its latest report that the Bitcoin market cap could rise by as much as $1 trillion after launching the spot ETFs.
Bitcoin Could See A 165% Rise When The Spot ETFs Launch
Yesterday, fake news of the approved iShares Bitcoin spot ETF took the sector by storm, as all cryptocurrencies observed sharp rallies. At the peak of this surge, BTC had approached the $30,000 level.
However, when the market realized the truth about the announcement, the asset quickly retraced to the levels it was at before the rally. While the gains were only brief, the rally nonetheless provided a glimpse into the strong reaction that the market could see to the launch of a real ETF.
This was just one spot ETF; however, several others are waiting in line to be approved. How would the market look like when all these ETFs have launched? In its new report, the on-chain analytics firm CryptoQuant has discussed precisely that.

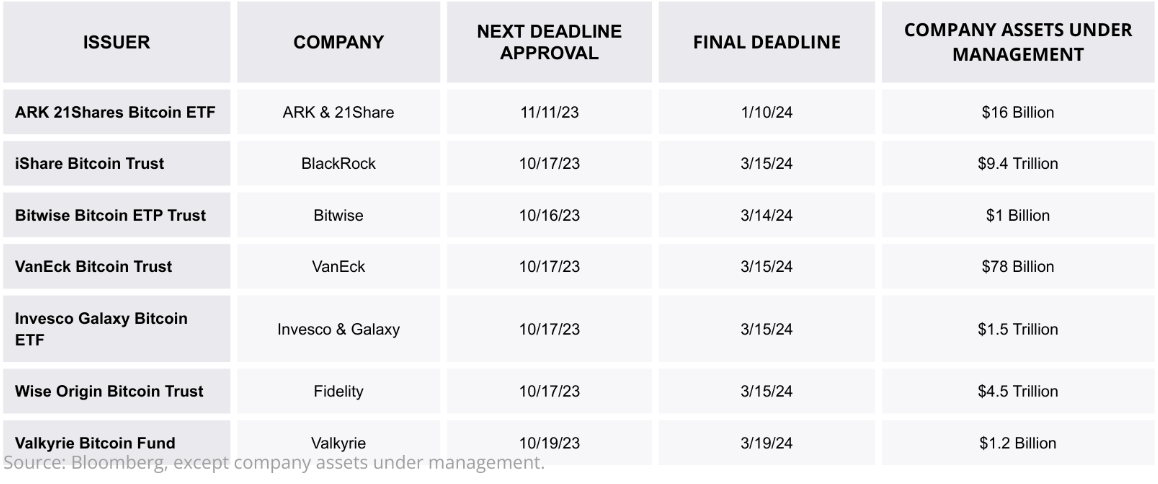
The assets under management of the various companies waiting for ETF approval | Source: CryptoQuant
The above table shows information about the various companies waiting to be approved for the Bitcoin spot ETF, including the total size of their assets under management (AUM).
“Although these ETFs are not expected to be approved this year, the probability that they will be approved by the final deadline (March 2024) has been growing as a result of favorable court rulings for Grayscale (GBTC Fund) and XRP in their respective legal fight against the SEC,” says the firm.
In total, these companies’ AUM are around $15.6 trillion. If they put just 1% of this amount towards BTC, it would mean inflows of a whopping $155 billion for the asset. “To put it in context, these amounts represent almost a third of the current market capitalization of Bitcoin,” notes CryptoQuant.
Now, how this capital inflow could affect the market cap of BTC isn’t exactly simple to say. Generally, the market cap increases by more than just the raw capital entering the cryptocurrency.
The firm has used the “realized cap” metric to assess this relationship. The realized cap is a capitalization method for BTC that calculates its total value by assuming that the value of each coin is the same as the price at which it was last transacted on the blockchain.
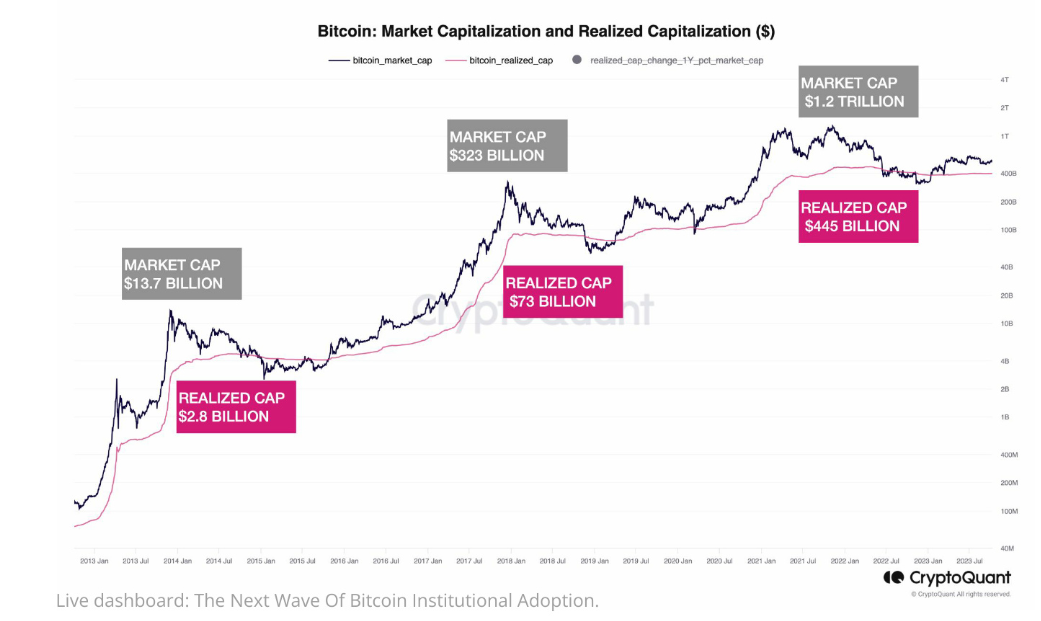
The realized cap can be imagined as the total investment made by the investors, accounting for the prices at which each bought their coins. The chart below shows how this realized cap has compared with the market over the years.

The comparison between the trends of the realized cap and market cap | Source: CryptoQuant
The graph shows that the market cap and realized cap usually have noticeably different growth rates, as they have always followed pretty different paths.
CryptoQuant has calculated the ratio between the annual growths of the two caps and has found that for most of the asset’s history, the market cap has grown by 3 to 6 times faster than the realized cap.
If the realized cap grows by $155 billion when the spot ETFs get approved and the asset managers allot 1% of their AUM to Bitcoin, the market cap could grow by between $450 and $900 billion.
The report notes this figure implies “the market cap would increase between 82% and 165% from the current level and that Bitcoin price could reach between $50K and $73K as a result of these inflows of fresh money.”
BTC Price
Bitcoin has enjoyed some uptrend over the past few days as the asset has now climbed above the $28,500 level.
BTC has seen some growth recently | Source: BTCUSD on TradingView


