
Reason to trust
How Our News is Made
Strict editorial policy that focuses on accuracy, relevance, and impartiality
Ad discliamer
Morbi pretium leo et nisl aliquam mollis. Quisque arcu lorem, ultricies quis pellentesque nec, ullamcorper eu odio.
- Bitcoin price is trading nicely above the $3,825 and $3,800 support levels against the US Dollar.
- The price is likely positioning for an upside break above the $3,880 and $3,900 resistance levels.
- Yesterday’s highlighted important bearish trend line is in place with resistance at $3,860 on the hourly chart of the BTC/USD pair (data feed from Kraken).
- The pair could surge higher once it clears the $3,860 resistance and the 100 hourly SMA.
Bitcoin price is setting up for the next key break against the US Dollar. BTC could either rally above $3,900 or decline below the $3,800 support in the coming sessions.
Bitcoin Price Analysis
After a sharp drop, bitcoin price found support near the $3,800 level against the US Dollar. The BTC/USD pair traded as low as $3,801 and later started a decent rebound. It traded above the $3,825 and $3,830 resistance levels to move into a short term positive zone. There was a break above the $3,850 level and the 50% Fib retracement level of the last decline from the $3,911 high to $3,800 swing low. However, the upside move was capped by the $3,880 resistance and the 100 hourly simple moving average.
The 61.8% Fib retracement level of the last decline from the $3,911 high to $3,800 swing low also acted as a resistance. There were a couple of failures to clear the $3,880 barrier, but buyers failed. Besides, yesterday’s highlighted important bearish trend line is in place with resistance at $3,860 on the hourly chart of the BTC/USD pair. If there is an upside break above the trend line, $3,870, and the 100 hourly SMA, there could be more gains.
The next stop for buyers could be $3,900, above which there are chances of more gains towards the $3,950 and $3,980 levels. The key resistance for a larger rally is near the $4,000 level. On the downside, an initial support is near the $3,825 level. If there is a break below $3,825, the price may struggle to hold the $3,800 support as well.
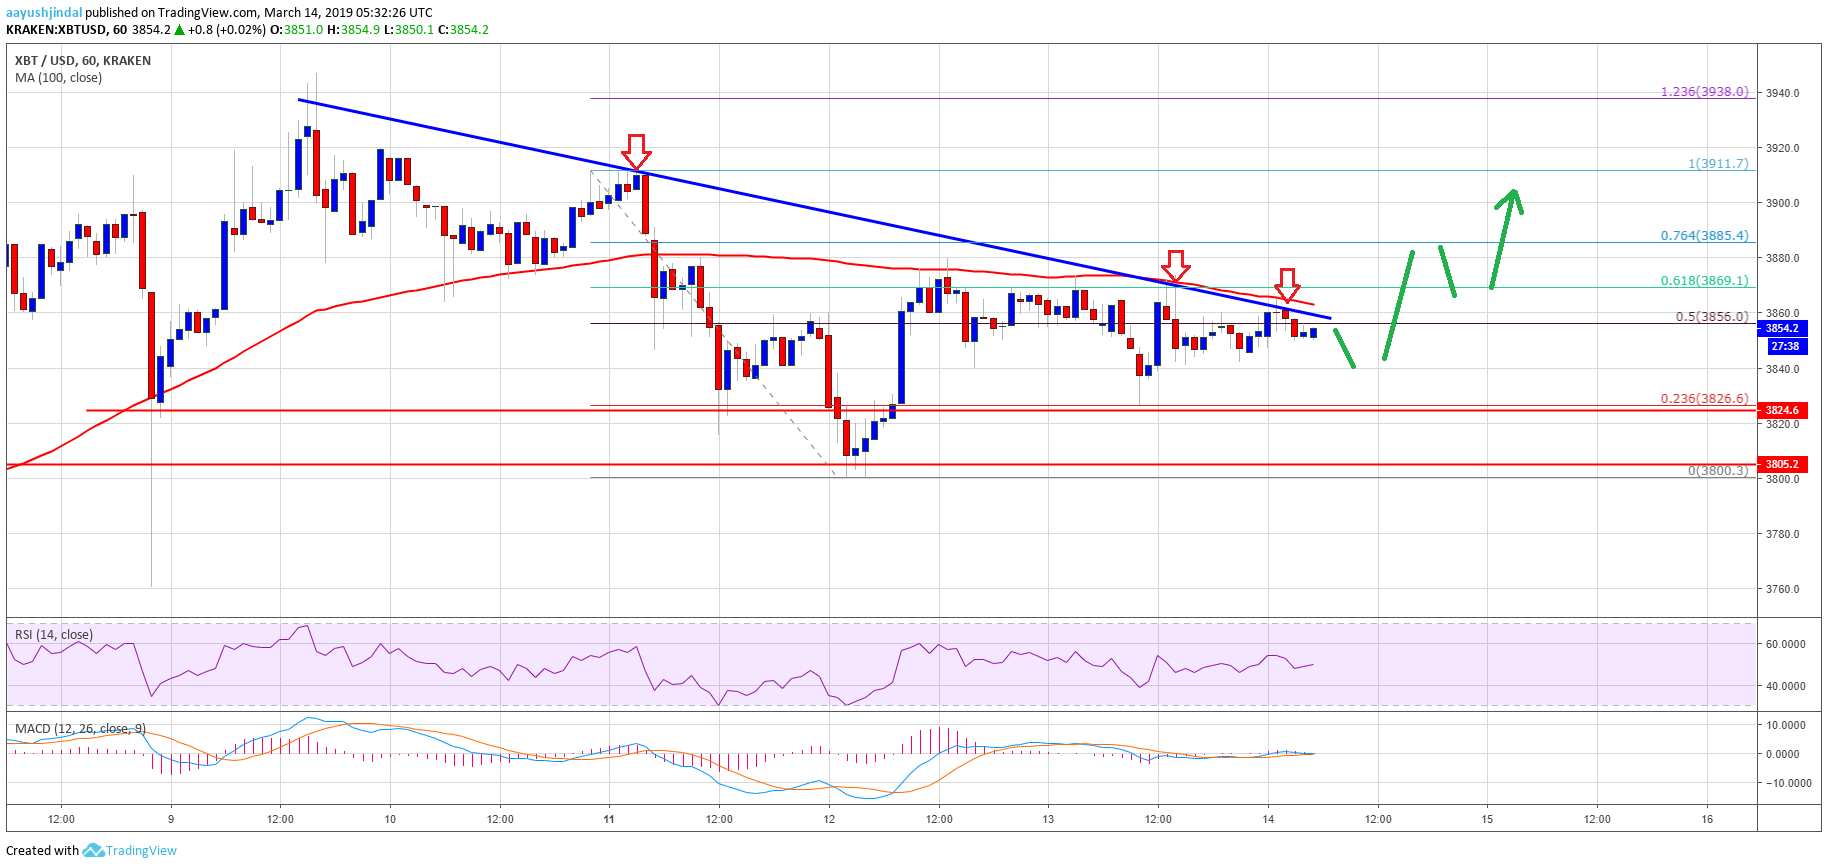
Looking at the chart, bitcoin price is facing a solid barrier near the $3,860 level and the 100 hourly SMA. In the short term, there could be a minor dip before the price makes an attempt to climb higher. The $3,860 and $3,880 levels are important, above which the chances of a strong upward move are likely to increase.
Technical indicators:
Hourly MACD – The MACD is placed is currently flat in the bearish zone.
Hourly RSI (Relative Strength Index) – The RSI for BTC/USD is currently just above the 50 level, with a positive angle.
Major Support Levels – $3,825 followed by $3,800.
Major Resistance Levels – $3,860, $3,880 and $3,900.


