
Reason to trust
How Our News is Made
Strict editorial policy that focuses on accuracy, relevance, and impartiality
Ad discliamer
Morbi pretium leo et nisl aliquam mollis. Quisque arcu lorem, ultricies quis pellentesque nec, ullamcorper eu odio.
- Bitcoin price made a few swing moves above the $3,800 and $3,830 supports against the US Dollar.
- The price managed to settle above the $3,850 level and the 100 hourly simple moving average.
- This week’s major bearish trend line with resistance at $3,845 was breached on the hourly chart of the BTC/USD pair (data feed from Kraken).
- The pair tested the $3,870 level and it is currently consolidating, with positive signs.
Bitcoin price climbed above key resistance levels against the US Dollar. BTC is trading with a bullish angle and it could rise above $3,900 and $3,940 in the coming sessions.
Bitcoin Price Analysis
The past three sessions were very volatile, with swing moves in bitcoin price above $3,800 against the US Dollar. The BTC/USD pair formed a large candle, taking out both short and long positions below the $3,900 resistance. The last swing low was formed at $3,832 before the price climbed higher. Buyers managed to push the price above the $3,850 resistance and the 100 hourly simple moving average.
More importantly, this week’s major bearish trend line with resistance at $3,845 was breached on the hourly chart of the BTC/USD pair. The pair failed to gain momentum after the break, but it settled above the trend line and $3,850, which is a positive sign. The price traded as high as $3,872 and it is currently correcting lower. It broke the $3,860 support and the 23.6% Fib retracement level of the recent wave from the $3,832 low to $3,872 high. However, there are many supports on the downside near $3,850 and the 100 hourly SMA.
The 50% Fib retracement level of the recent wave from the $3,832 low to $3,872 high is also near $3,850. Besides, there is a connecting bullish trend line formed near $3,845 on the same chart. Therefore, there are chances of bullish moves as long as the price is above $3,845. On the upside, the price could break the $3,875 level and test $3,900. If buyers clear the $3,900 resistance, the price may rise towards the $4,000 barrier.
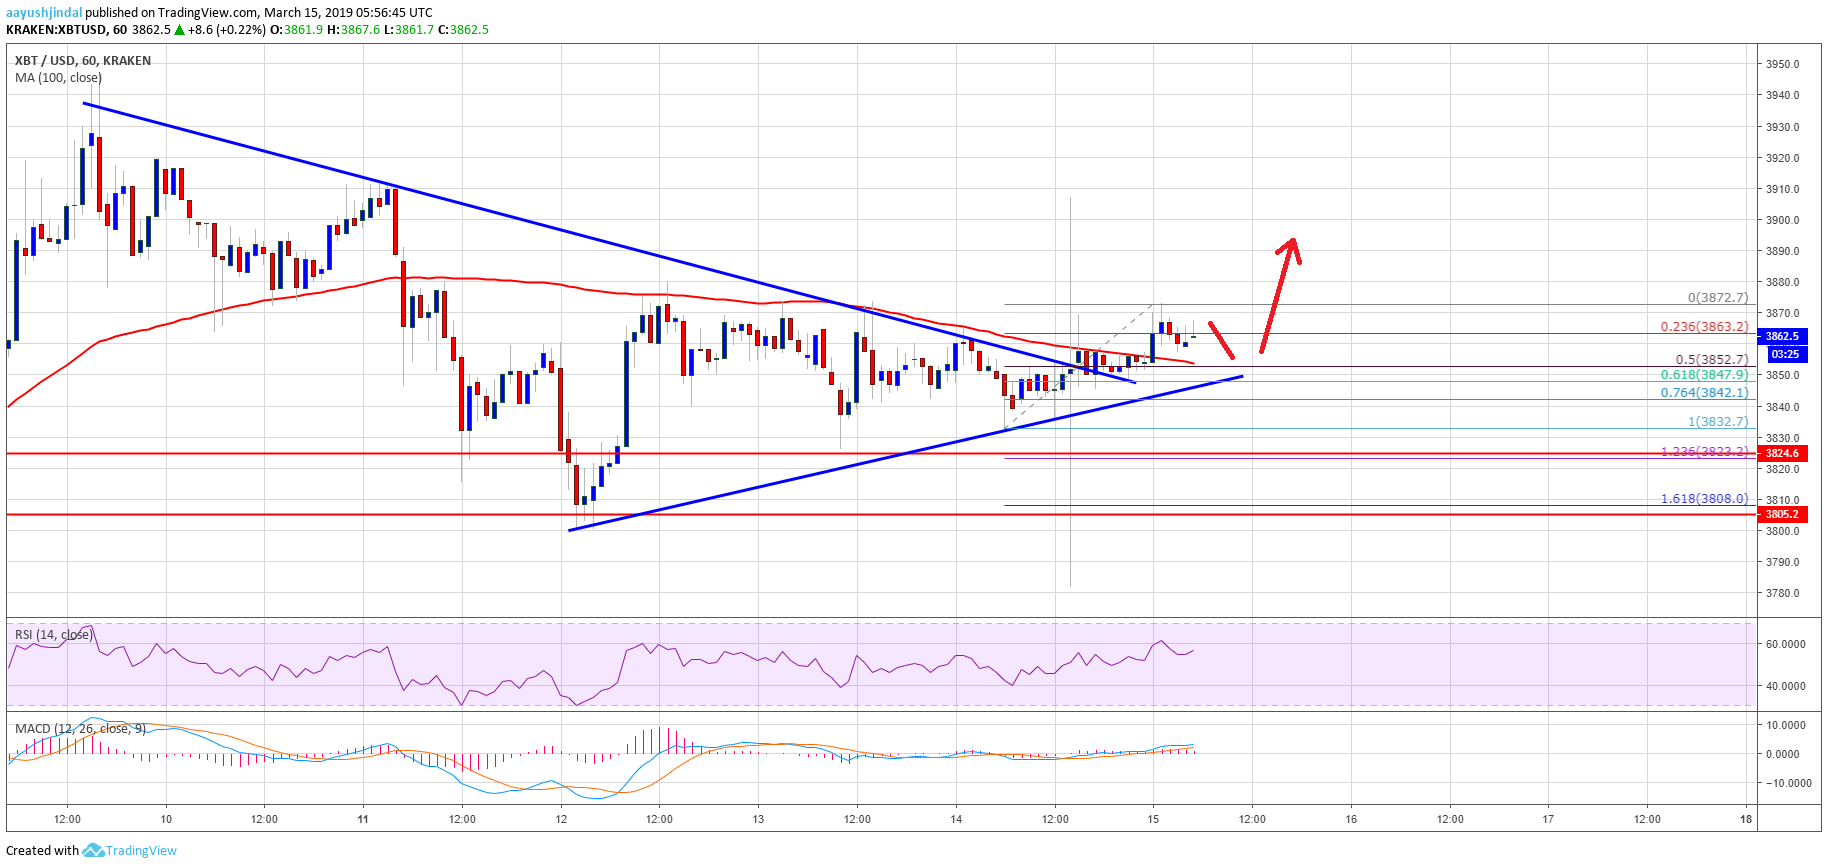
Looking at the chart, bitcoin price is trading in a positive zone above $3,850. The current technical structure suggests more upsides above $3,875 and $3,900 in the coming sessions. On the other hand, a downside break below $3,850 and $3,840 may negate the current bullish bias. The next key supports are near $3,825 and $3,800.
Technical indicators:
Hourly MACD – The MACD is moving nicely in the bullish zone.
Hourly RSI (Relative Strength Index) – The RSI for BTC/USD is now well above the 50 level, with a bullish angle.
Major Support Levels – $3,840 followed by $3,825.
Major Resistance Levels – $3,875, $3,880 and $3,900.


