
Reason to trust
How Our News is Made
Strict editorial policy that focuses on accuracy, relevance, and impartiality
Ad discliamer
Morbi pretium leo et nisl aliquam mollis. Quisque arcu lorem, ultricies quis pellentesque nec, ullamcorper eu odio.
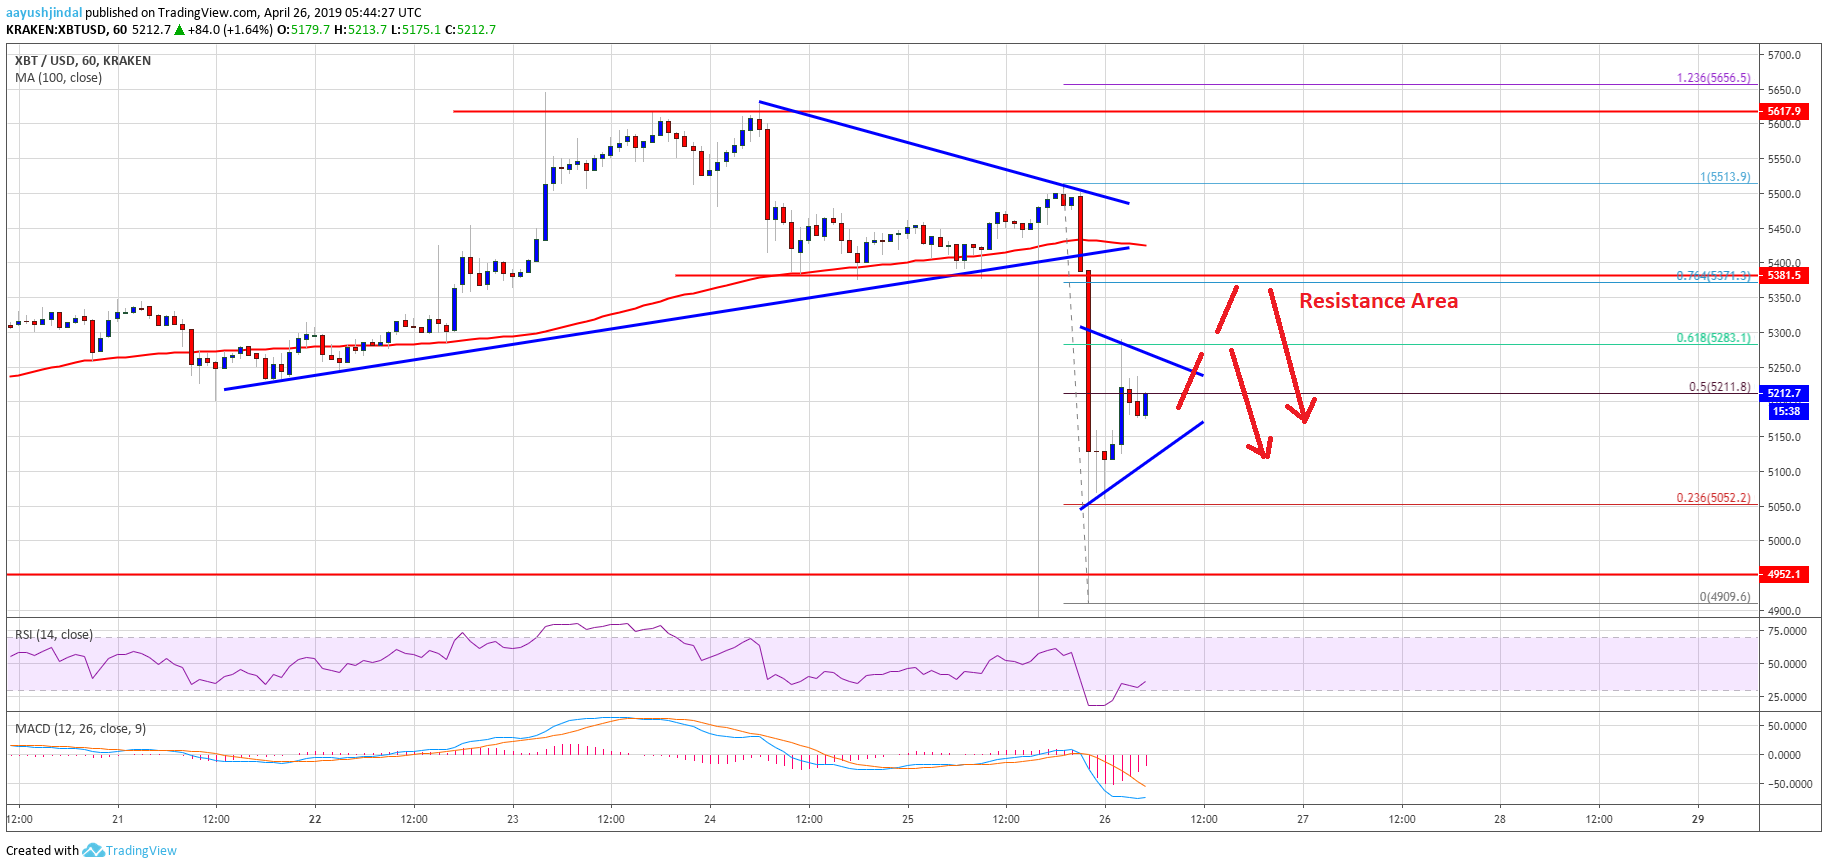
- Bitcoin price declined sharply after it broke the key $5,400 and $5,380 supports against the US Dollar.
- The price even broke the $5,000 support level and tested the $4,900 support area.
- There was a break below a major bullish trend line with support at $5,410 on the hourly chart of the BTC/USD pair (data feed from Kraken).
- The pair must climb back above $5,400 to avoid a fresh drop towards the $5,000 support area.
Bitcoin price declined heavily below $5,400 and $5,250 against the US Dollar. BTC is currently correcting higher, but it is likely to face a strong selling interest near $5,250 and $5,380.
Bitcoin Price Analysis
The past two sessions were eventful since there were heavy moves in bitcoin price below $5,400 against the US Dollar. After consolidating for a few hours above the $5,400 support, the BTC/USD pair started a strong decline. There were two nasty red candles formed and the price broke the $5,250 and $5,120 support levels. The decline started after there was a break below a major bullish trend line with support at $5,410 on the hourly chart.
The pair settled below the $5,250 level and the 100 hourly simple moving average. Sellers took control and pushed the price below the $5,000 support as well. A new weekly swing low as formed at $4,909 and the price is currently correcting higher. It already moved above the 50% Fib retracement level of the recent decline from the $5,513 high to $4,909 swing low. However, the $5,280 level acted as a strong resistance. Besides, the 61.8% Fib retracement level of the recent decline from the $5,513 high to $4,909 swing low also stopped gains.
At the moment, the price is consolidating near $5,180, with hurdles near $5,250, $5,280 and $5,300. Above $5,300, the main resistance is near the $5,380 level (the previous support). To start a strong upward move, the price must climb back above $5,400a and the 100 hourly simple moving average. If bitcoin continues to struggle near the $5,300 and $5,380 levels, it could resume its decline.
Looking at the chart, bitcoin price clearly moved into a bearish zone below $5,380 and the 100 hourly simple moving average. It could correct in the short term, but sellers are likely to defend the $5,380-5,400 zone. On the downside, the price could revisit the $5,000 support area if it breaks the $5,120 support.
Technical indicators:
Hourly MACD – The MACD is slowly reducing its bearish slope, with no positive sign.
Hourly RSI (Relative Strength Index) – The RSI for BTC/USD recovered from the 20 level and it is currently near 30.
Major Support Levels – $5,120 followed by $5,000.
Major Resistance Levels – $5,250, $5,380 and $5,400.


