
Reason to trust
How Our News is Made
Strict editorial policy that focuses on accuracy, relevance, and impartiality
Ad discliamer
Morbi pretium leo et nisl aliquam mollis. Quisque arcu lorem, ultricies quis pellentesque nec, ullamcorper eu odio.
- Bitcoin price failed to surpass the $4,000 resistance level and declined against the US Dollar.
- The price declined sharply and broke the key $3,940 support area to enter a bearish zone.
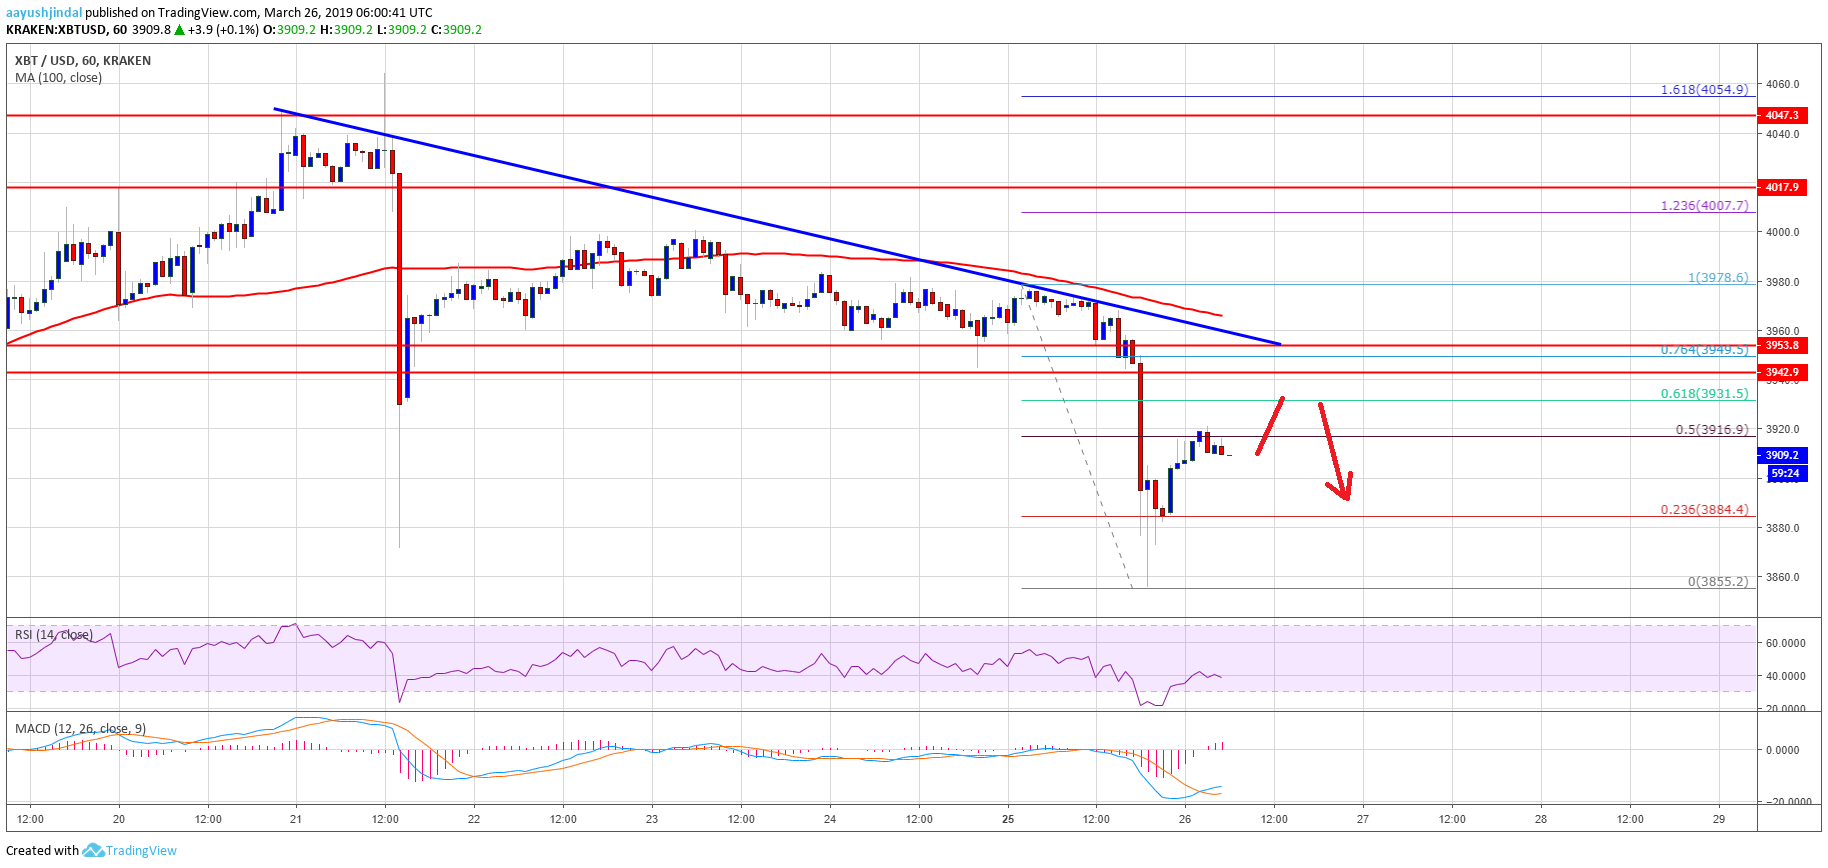
- Yesterday’s highlighted major bearish trend line is intact with resistance at $3,950 on the hourly chart of the BTC/USD pair (data feed from Kraken).
- The pair traded towards the $3,850 support and it is currently higher towards key resistances.
Bitcoin price declined below important supports near $3,940 against the US Dollar. BTC might correct in the short term, but sellers are likely to protect gains above $3,940.
Bitcoin Price Analysis
After multiple failures near the $4,000 resistance, bitcoin price started a sharp decline against the US Dollar. The BTC/USD pair formed a swing high near $3,980 and later declined below the key $3,940 support area. Sellers gained control and the price even broke the $3,900 support level. The price traded to a new weekly low at $3,855 and settled well below the 100 hourly simple moving average. Later, the price started an upside correction above the $3,900 level.
The price cleared the 23.6% Fib retracement level of the recent decline from the $3,978 high to $3,855 low. However, the price is currently facing resistance near $3,920. It represents the 50% Fib retracement level of the recent decline from the $3,978 high to $3,855 low. In the short term, the price might correct above the $3,920 level. Having said that, there is a strong resistance near the $3,940 and $3,950 levels.
Besides, yesterday’s highlighted major bearish trend line is intact with resistance at $3,950 on the hourly chart of the BTC/USD pair. The 61.8% Fib retracement level of the recent decline from the $3,978 high to $3,855 low might also prevent gains near $3,930. Therefore, if the price corrects higher, it is likely to face a strong resistance near $3,940 and $3,950. A proper close above the $3,950 resistance plus the 100 hourly SMA is must for a decent rebound towards $4,000.
Looking at the chart, bitcoin price clearly moved into a bearish zone below the $3,940 support level. On the downside, an immediate support is at $3,880, below which the price is likely to revisit the $3,850 support. If there are more losses below $3,850, the next stop for sellers could be $3,800. On the upside, the main resistance is at $3,950, above which there are chances of a fresh increase.
Technical indicators:
Hourly MACD – The MACD moved back in the bullish zone.
Hourly RSI (Relative Strength Index) – The RSI for BTC/USD recovered recently, but it is still well below the 50 level.
Major Support Levels – $3,880 followed by $3,850.
Major Resistance Levels – $3,930, $3,940 and $3,950.


