
Reason to trust
How Our News is Made
Strict editorial policy that focuses on accuracy, relevance, and impartiality
Ad discliamer
Morbi pretium leo et nisl aliquam mollis. Quisque arcu lorem, ultricies quis pellentesque nec, ullamcorper eu odio.
- Bitcoin price is currently correcting higher and it broke the key $8,200 resistance against the US Dollar.
- The price is now consolidating gains below the $8,300 and $8,350 resistance levels.
- There is a short term breakout or bullish continuation pattern forming with resistance near $8,250 on the hourly chart of the BTC/USD pair (data feed from Kraken).
- The price could struggle to continue higher and it might correct towards the $8,100 support.
Bitcoin price is rebounding nicely above $8,100 and $8,200 against the US Dollar. However, it is still early to call the current move as a trend change in BTC.
Bitcoin Price Analysis
This past week, we saw mostly bearish moves in bitcoin below the $8,200 support area against the US Dollar. BTC price even settled below $8,000 and the 100 hourly simple moving average. However, the $7,800 area acted as a strong support. As a result, BTC started a decent recovery above the $8,000 resistance area and the 100 hourly SMA. Moreover, there was a break above a contracting triangle with resistance near $8,000 on the hourly chart.
More importantly, the price surpassed the main $8,200 resistance area (as discussed in the weekly forecast). Finally, the price traded above the $8,250 level and tested the $8,300 zone. A high was formed near $8,305 and the price is currently consolidating gains. An immediate support is near the $8,200 level or the 23.6% Fib retracement level of the recent recovery from the $7,884 low to $8,305 high.
Additionally, there is a short term breakout or bullish continuation pattern forming with resistance near $8,250 on the same chart. If there is an upside break above $8,250, bitcoin price could continue to rise towards the $8,300 and $8,350 resistance levels. The next key resistance on the upside is near the $8,400 level.
Conversely, if there is a downside break below the $8,200 support, the price could start an extended downside correction. The next key support is near the $8,100 area. Moreover, the 50% Fib retracement level of the recent recovery from the $7,884 low to $8,305 high is also near the $8,095 level to provide support. If there are more downsides, the price could test $8,000 and the 100 hourly SMA.
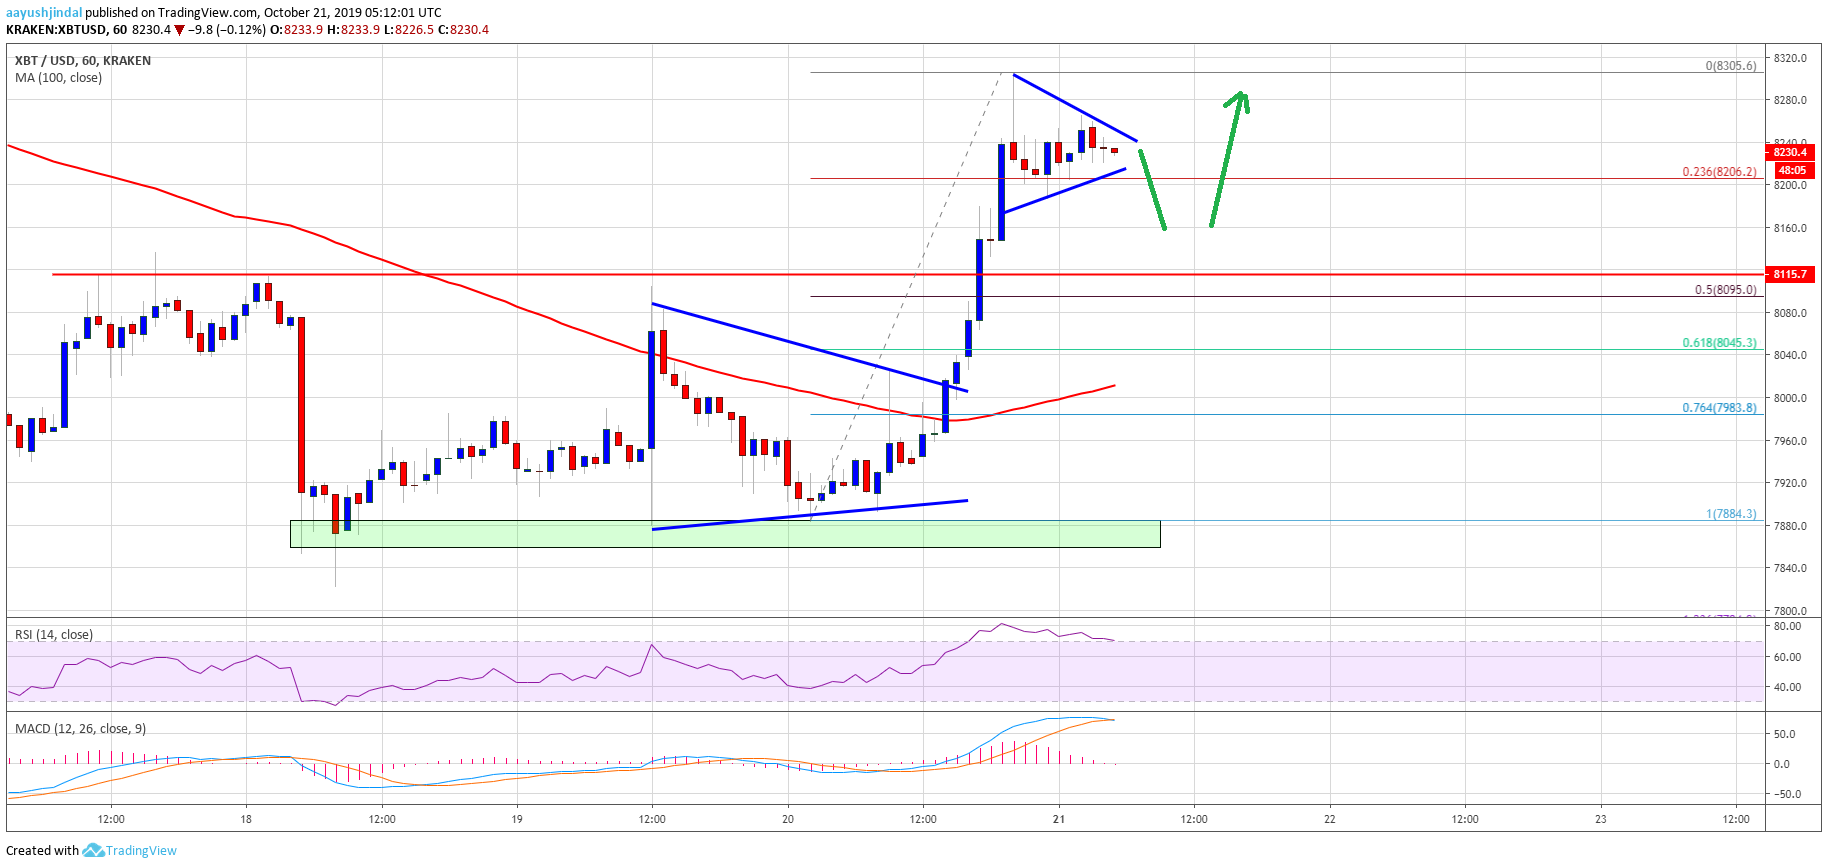
Looking at the chart, bitcoin seems to be recovering nicely above $8,200. However, the current price action below $8,300 still suggests signs of caution. Only a close above $8,400 may perhaps call for a strong rise towards $9,000 and $9,200.
Technical indicators:
Hourly MACD – The MACD is losing momentum in the bullish zone.
Hourly RSI (Relative Strength Index) – The RSI for BTC/USD is currently correcting lower towards the 60 level.
Major Support Levels – $8,200 followed by $8,100.
Major Resistance Levels – $8,250, $8,300 and $8,400.


