
Reason to trust
How Our News is Made
Strict editorial policy that focuses on accuracy, relevance, and impartiality
Ad discliamer
Morbi pretium leo et nisl aliquam mollis. Quisque arcu lorem, ultricies quis pellentesque nec, ullamcorper eu odio.
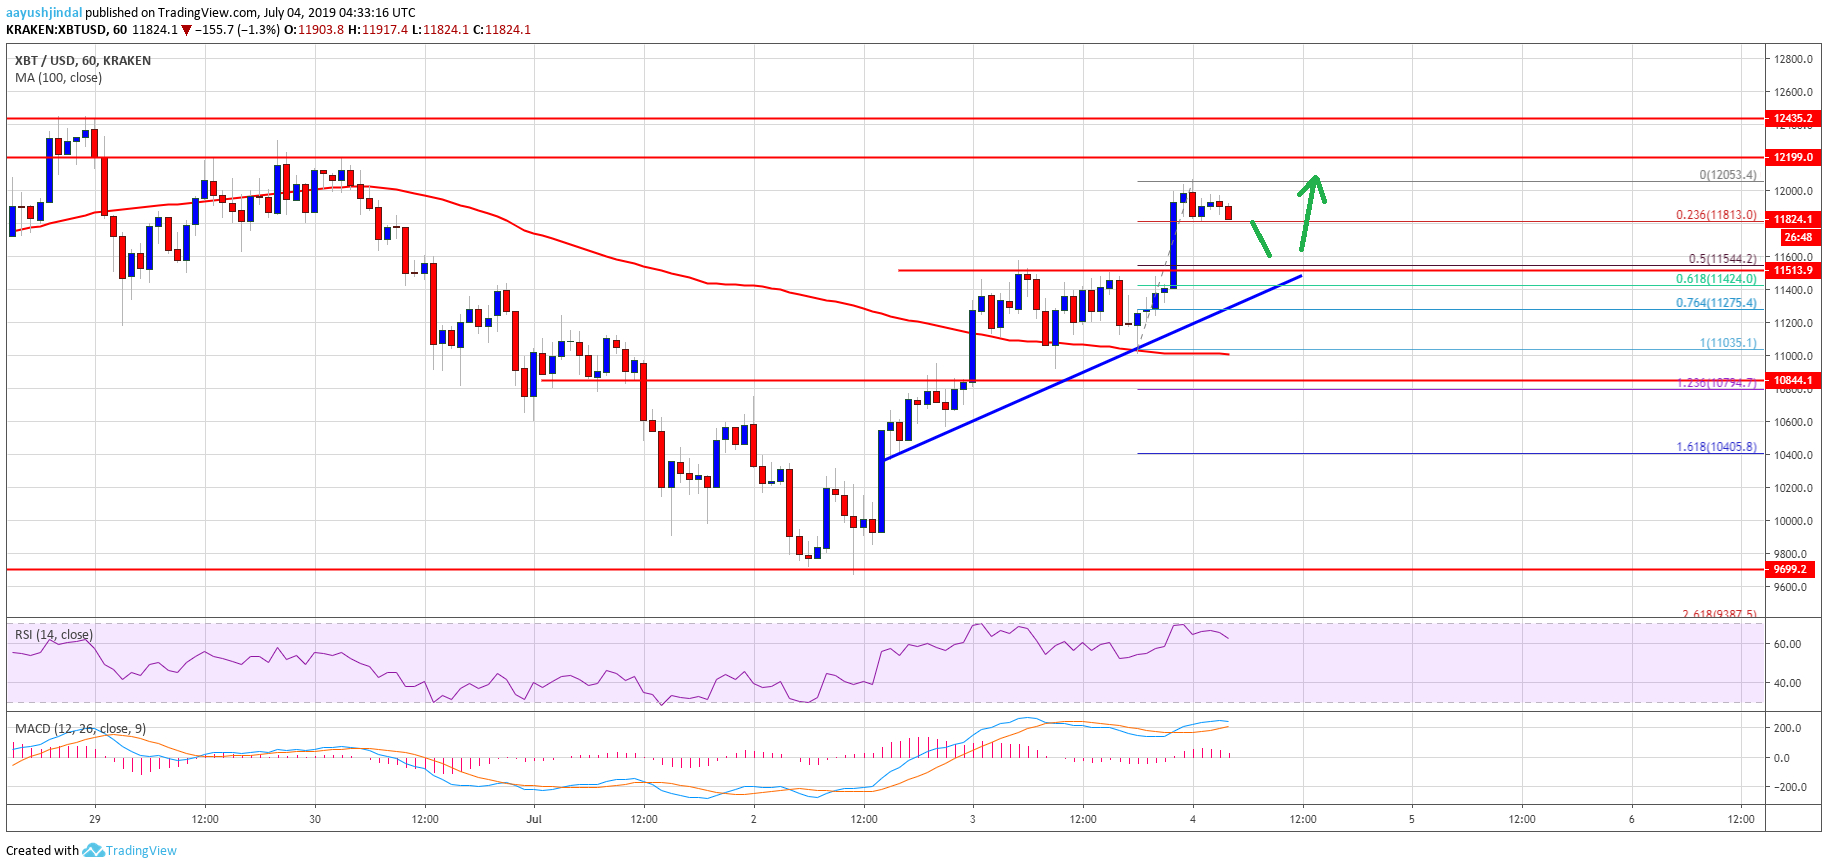
- There was a steady rise in bitcoin price and it tested the $12,000 resistance level.
- It traded as high as $12,053 and is currently correcting gains towards $11,600.
- There is a new connecting bullish trend line forming with support near $11,550 on the hourly chart of the BTC/USD pair (data feed from Kraken).
- The pair remains well supported on the downside and it seems like it could continue towards $12,500.
There were steady gains in bitcoin price above the $11,500 resistance level against the US Dollar. BTC tested the first target of $12,000 and it may soon climb towards the $12.5K target.
Bitcoin Price Analysis
Yesterday, we saw a reversal pattern in bitcoin price from the $10,000 support against the US Dollar. The BTC/USD pair made a nice 15% move and climbed above the $11,000 and $11,200 resistance levels. Moreover, there was a close above the $11,200 level and the 100 hourly simple moving average. We also discussed the chances of a test of the $12,000 resistance level.
The price did climb higher and traded above the $12,000 target. A new intraday high was formed at $12,053 and the price is currently correcting lower. It is trading near the $11,800 level and the 23.6% Fib retracement level of the recent wave from the $11,035 low to $12,053 high. On the downside, there are many supports near the $11,600 and $11,500 levels.
Besides, there is a new connecting bullish trend line forming with support near $11,550 on the hourly chart of the BTC/USD pair. The trend line support coincides with the 50% Fib retracement level of the recent wave from the $11,035 low to $12,053 high. If there is a downside break below the $11,500 support, bitcoin price could extend the current correction towards the $11,275 support area. Any further losses might push the price towards $11,000 or the 100 hourly SMA.
On the upside, the $12,000 level is an initial resistance. Once there is a break above the $12,000 resistance and the $12,050 swing high, there could be more gains. In the mentioned case, the price could trade towards our second target of $12,500.
Looking at the chart, bitcoin price is trading nicely above the $11,600 and $11,500 support levels. As long as there is no close below $11,000, the bulls remain in action. On the upside, the main target this week could be $12,500, followed by $12,650.
Technical indicators:
Hourly MACD – The MACD is slowly losing momentum in the bullish zone.
Hourly RSI (Relative Strength Index) – The RSI for BTC/USD is currently correcting lower towards the 50 level.
Major Support Levels – $11,600 followed by $11,500.
Major Resistance Levels – $12,000, $12,500 and $12,650.


