
Reason to trust
How Our News is Made
Strict editorial policy that focuses on accuracy, relevance, and impartiality
Ad discliamer
Morbi pretium leo et nisl aliquam mollis. Quisque arcu lorem, ultricies quis pellentesque nec, ullamcorper eu odio.
- Bitcoin price declined heavily yesterday and traded close to the $6,650 support against the US Dollar.
- The price traded as low as $6,645 and it is currently recovering towards the $7,400 level.
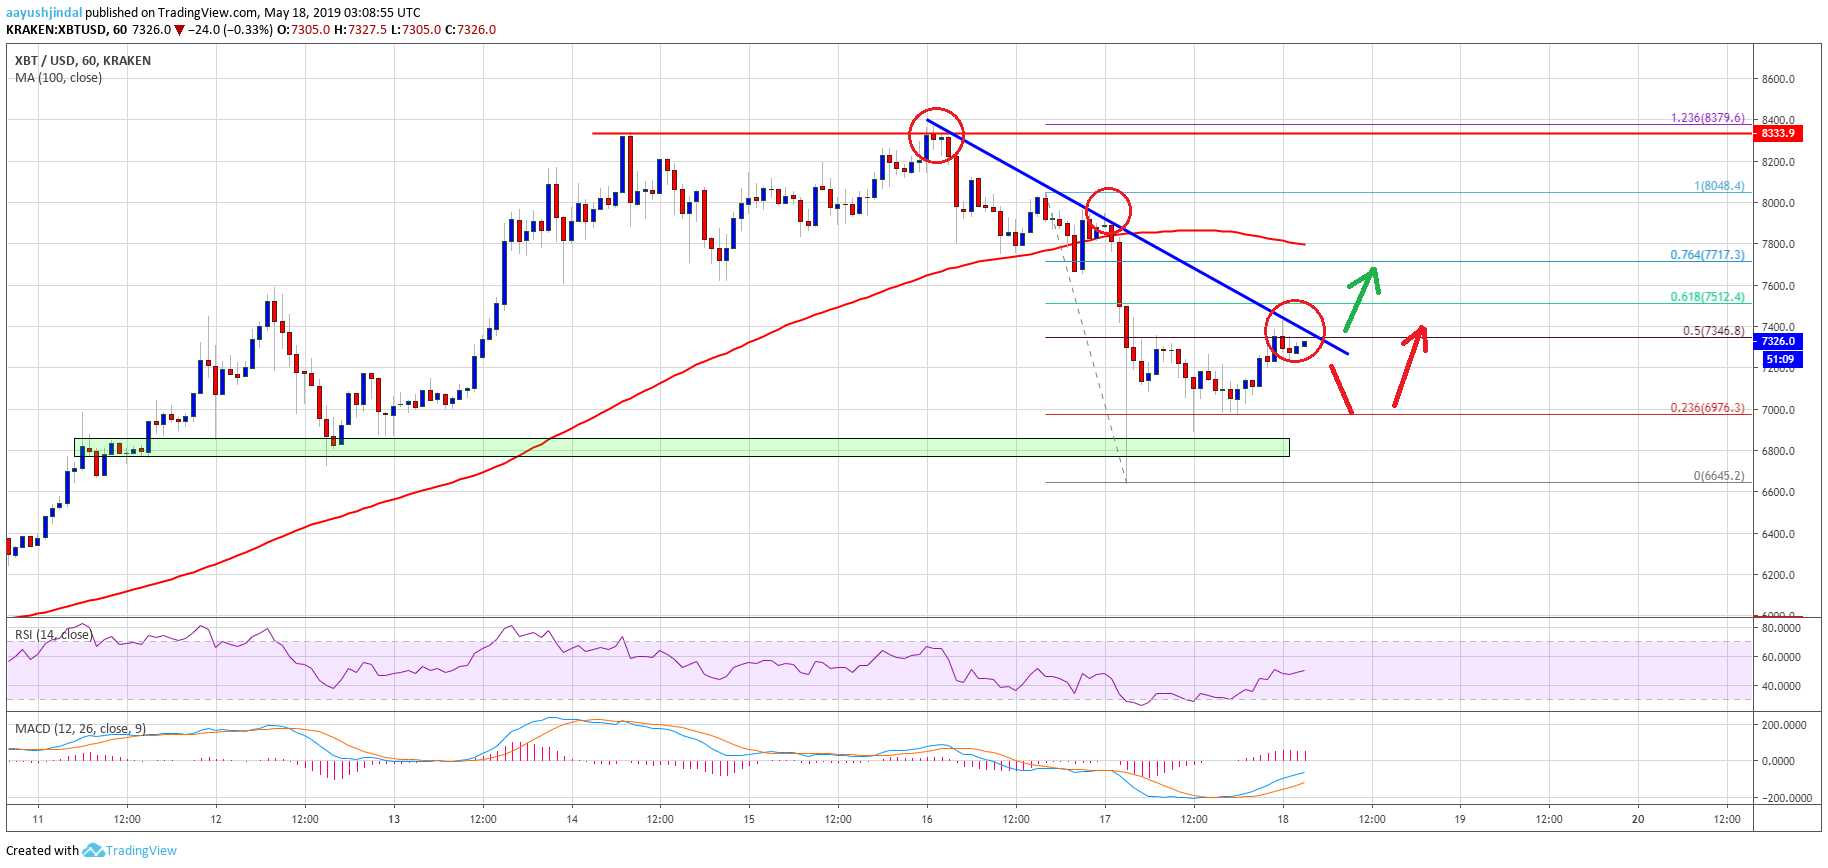
- There is a key bearish trend line forming with resistance at $7,400 on the hourly chart of the BTC/USD pair (data feed from Kraken).
- The pair needs to clear the $7,400 and $7,512 resistance levels to start a strong upward move.
Bitcoin price seems to be forming a new support base above $7,000 against the US Dollar. BTC is likely forming a decent bottom and it could climb higher above $7,400 and $7,500.
Bitcoin Price Analysis
Yesterday, we saw a significant downside correction in bitcoin price below the $8,000 and $7,500 supports against the US Dollar. The BTC/USD pair declined heavily and even broke the $7,000 support and 100 hourly simple moving average. Finally, there was a spike towards the $6,650 support area, where buyers emerged. A swing low was formed at $6,645 and the price recently started an upside correction. It traded above the $7,000 and $7,050 resistance levels. Besides, there was a break above the 23.6% Fib retracement level of the recent decline from the $8,050 swing high to $6,645 low.
At the moment, the price is trading above $7,200, but it is facing a strong resistance near $7,400. There is also a key bearish trend line forming with resistance at $7,400 on the hourly chart of the BTC/USD pair. Moreover, the price is struggling near the 50% Fib retracement level of the recent decline from the $8,050 swing high to $6,645 low. If there is a proper break above the trend line and $7,420, the price could trade further higher.
An important hurdle is near the $7,512 level and the 61.8% Fib retracement level of the recent decline from the $8,050 swing high to $6,645 low. A successful follow through above $7,512 is likely to set the pace for more gains in the near term. The next key resistances are near the $7,720 and $7,800 levels. On the downside, an initial support is near the $7,200 level. If there are further declines, the price could retest the $7,000 support.
Looking at the chart, bitcoin price is currently trading with a positive bias above the $7,000 support. Therefore, there are high chances of a fresh increase above the $7,400 and $7,500 levels. Only a close below $7,000 could increase bearish pressure in the near term.
Technical indicators:
Hourly MACD – The MACD is back in the bullish zone, with a positive bias.
Hourly RSI (Relative Strength Index) – The RSI for BTC/USD is moving higher and is currently above the 50 level.
Major Support Levels – $7,200 followed by $7,000.
Major Resistance Levels – $7,400, $7,512 and $7,720.


