
Reason to trust
How Our News is Made
Strict editorial policy that focuses on accuracy, relevance, and impartiality
Ad discliamer
Morbi pretium leo et nisl aliquam mollis. Quisque arcu lorem, ultricies quis pellentesque nec, ullamcorper eu odio.
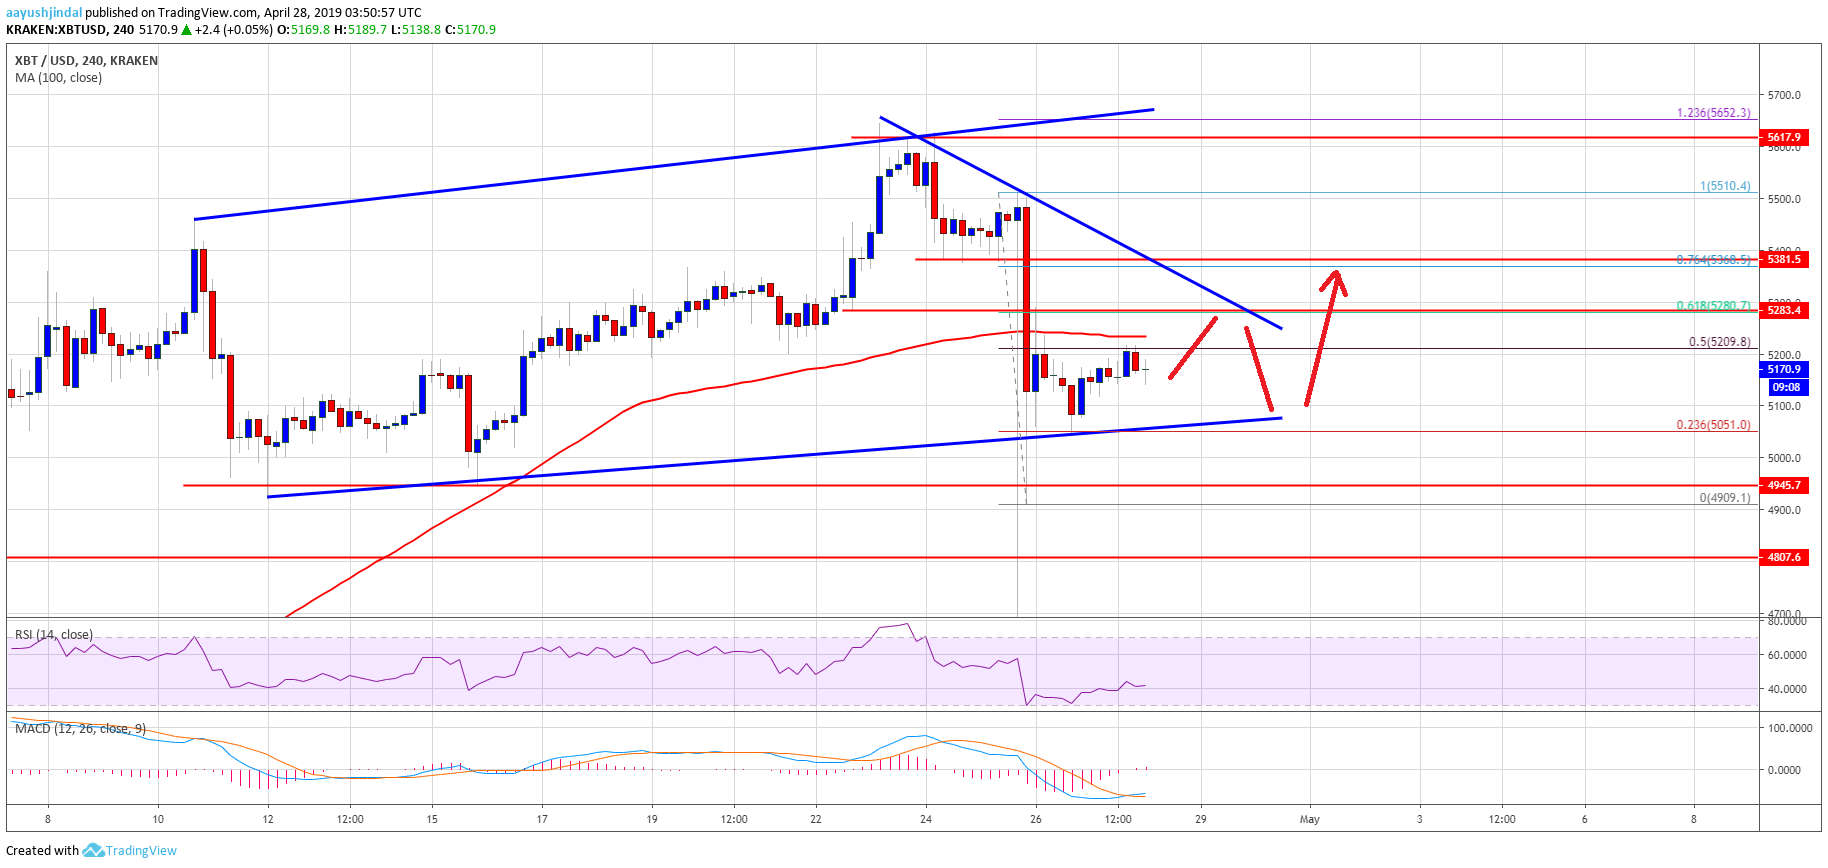
- There was a strong decline in bitcoin price below the $5,280 support level against the US Dollar.
- The price even spiked below the $5,000 support level and it is currently consolidating above $5,100.
- There is a major bullish trend line in place with support at $5,080 on the 4-hours chart of the BTC/USD pair (data feed from Kraken).
- The pair could bounce back as long as there is no weekly close below the $5,000 support level.
Bitcoin price started consolidating losses after a strong decline against the US Dollar. BTC is likely to recover above $5,200 and $5,280 in the near term unless the $5,000 gives way.
Bitcoin Price Weekly Analysis (BTC)
This past week, there was a significant rejection in bitcoin price near the $5,660 level against the US Dollar. The BTC/USD pair started a strong downward move below $5,400 after tether’s drama. The price tumbled below the key $5,280 and $5,200 support levels. There was even a spike below $5,000, plus a close below the 100 simple moving average (4-hours). A swing low was formed near the $4,910 level and recently the price recovered above $5,000 and $5,050.
At the moment, the price is testing the 50% Fib retracement level of the last drop from the $5,510 swing high to $4,910 swing low. However, the $5,220 area and the 100 simple moving average (4-hours) are acting as hurdles. Above $5,220, there is a major resistance near $5,280 and a connecting bearish trend line. The 61.8% Fib retracement level of the last drop from the $5,510 swing high to $4,910 swing low is also near the $5,280 level. A successful close above the $5,280 level might trigger a decent recovery in the near term.
On the downside, there is a major bullish trend line in place with support at $5,080 on the 4-hours chart of the BTC/USD pair. The trend line support near $5,080 is very important, below which the price could test $5,000. If there is a daily close below $5,000, the price is likely to move further into a bearish zone. In the mentioned case, the price will most likely test $4,800 or $4,750.
Looking at the chart, bitcoin price faced a strong selling interest below $5,400. However, it managed to stay above the $5,000 support. Therefore, there are chances of a recovery above the $5,280 resistance levels. If there is a close above $5,280, there are chances of move towards $5,400 or even $5,500.
Technical indicators
4 hours MACD – The MACD for BTC/USD is slowly moving into the bullish zone.
4 hours RSI (Relative Strength Index) – The RSI for BTC/USD is back above the 40 level, with a few positive signs.
Major Support Level – $5,050
Major Resistance Level – $5,280


