
Reason to trust
How Our News is Made
Strict editorial policy that focuses on accuracy, relevance, and impartiality
Ad discliamer
Morbi pretium leo et nisl aliquam mollis. Quisque arcu lorem, ultricies quis pellentesque nec, ullamcorper eu odio.
Bitcoin is up around 4% and it is approaching the $10,000 resistance against the US Dollar. BTC price is likely to extend its rally above $10,000 unless it dives below the $9,500 support.
- Bitcoin is currently gaining bullish momentum and trading near the last swing high at $9,950.
- The price is trading well above the $9,600 support and the 100 hourly simple moving average.
- There is a key bullish trend line forming with support near $9,720 on the hourly chart of the BTC/USD pair (data feed from Kraken).
- The pair could correct a few points, but there are high chances of an upside break above $9,950 and $10K.
Bitcoin Gaining Bullish Momentum
After a short term downside correction, bitcoin found support near the $9,200 zone against the US Dollar. BTC price remained well bid above the 100 hourly simple moving average and started a fresh increase from $9,200.
There was a break above the $9,400 and $9,500 resistance levels, opening the doors for another positive wave. The upward move was such that the price surpassed the $9,800 level and revisited the $9,950 resistance level.
A high is formed near $9,945 and bitcoin price is currently attempting an upside break above the $9,950 resistance. An initial support is near the $9,850 level. It is close to the 23.6% Fib retracement level of the recent rise from the $9,596 low to $9,945 high.
The first substantial support is seen near the $9,770 level since it represents the 50% Fib retracement level of the recent rise from the $9,596 low to $9,945 high. Moreover, there is a key bullish trend line forming with support near $9,720 on the hourly chart of the BTC/USD pair.
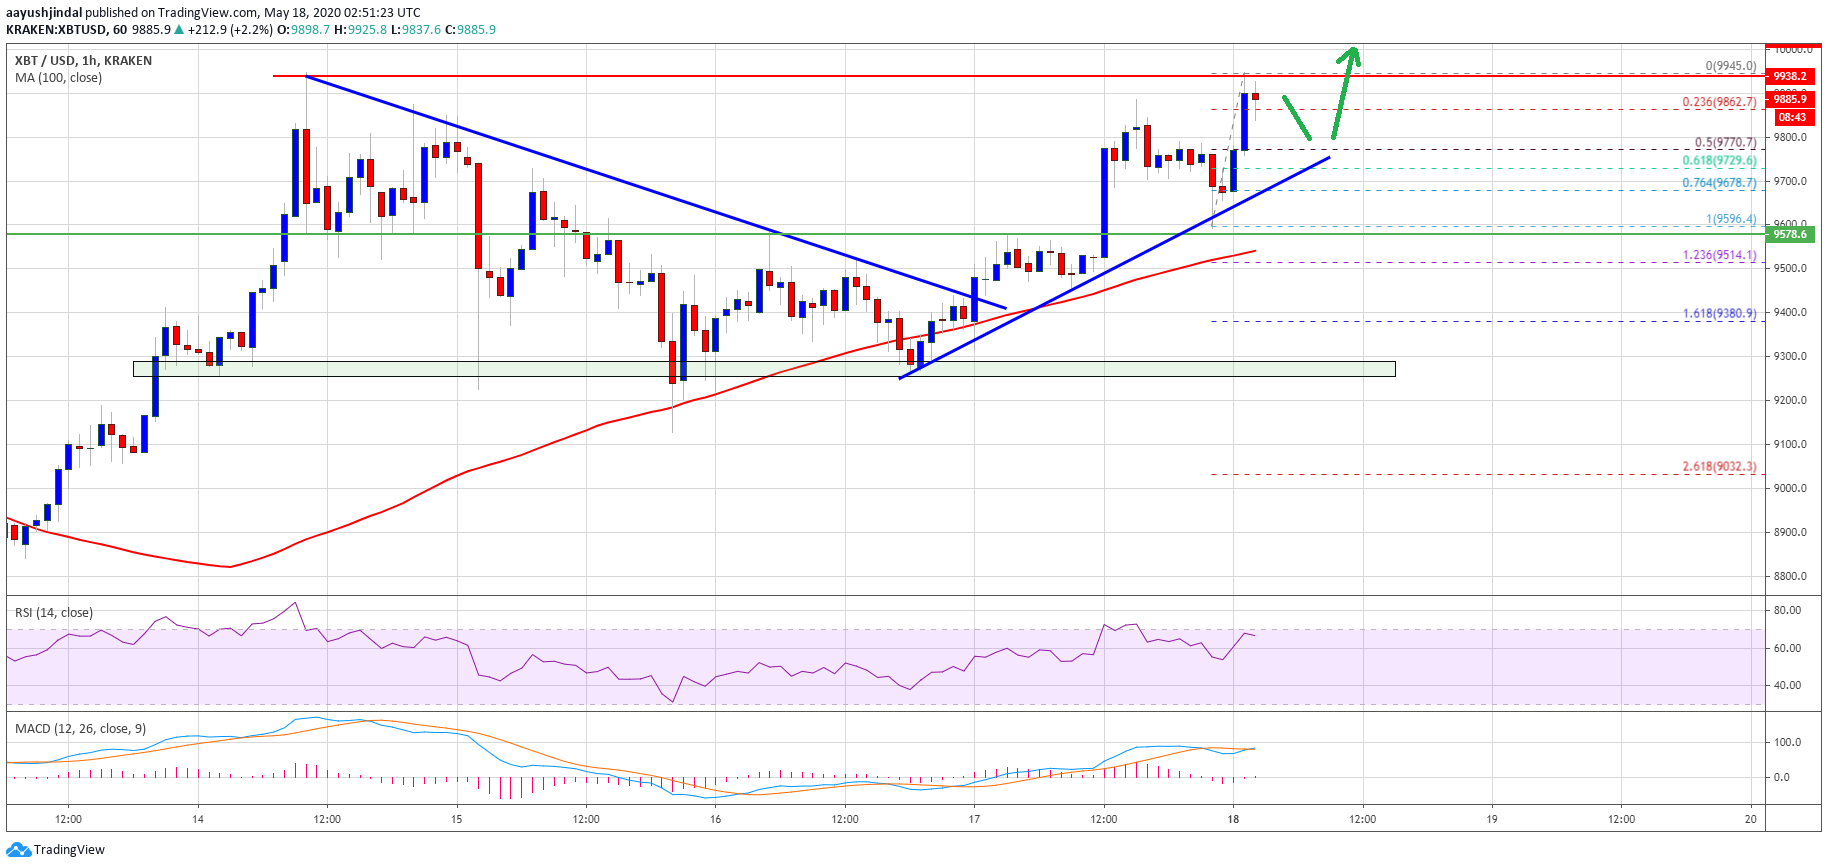
On the upside, the bulls are facing a significant hurdle near the $9,950 and $10,000 levels. A successful break and close above the $10,000 resistance may perhaps open the doors for a sustained upward move. The next resistance could be $10,500, above which the bulls might aim $11,200.
Bearish Reaction?
If bitcoin fails again to clear the $9,950 resistance zone, there could be a bearish reaction. If the price breaks the trend line support, it could test the main support near the $9,500 level.
The 100 hourly SMA is also near $9,500. If the bulls fail to defend the $9,500 support, there is a risk of a double top pattern, resulting in a sharp decline below $9,200 and $9,000 in the near term.
Technical indicators:
Hourly MACD – The MACD is slowly gaining momentum in the bullish zone.
Hourly RSI (Relative Strength Index) – The RSI for BTC/USD is now well above the 60 level.
Major Support Levels – $9,720 followed by $9,500.
Major Resistance Levels – $9,950, $10,000 and $10,500.


