
Reason to trust
How Our News is Made
Strict editorial policy that focuses on accuracy, relevance, and impartiality
Ad discliamer
Morbi pretium leo et nisl aliquam mollis. Quisque arcu lorem, ultricies quis pellentesque nec, ullamcorper eu odio.
Bitcoin is up more than 3%, and it broke the key $9,500 resistance against the US Dollar. BTC is currently trading in a positive zone, and it could continue to rise towards $10,000.
- Bitcoin is up over $300, and it broke a few significant hurdles near $9,500.
- The price traded close to the $9,800 resistance zone, and it settled above the 100 hourly simple moving average.
- There is a crucial bullish trend line forming with support near $9,600 on the hourly chart of the BTC/USD pair (data feed from Kraken).
- The pair could correct in the short-term, but dips remain supported for a push towards $10,000.
Bitcoin Price Gains Bullish Momentum
Yesterday, we discussed 3 key reasons why bitcoin price could surge above $9,500 against the US Dollar. BTC did gain bullish momentum and it broke many hurdles near $9,400 and $9,500 to move into a positive zone.
There was a close above the $9,500 resistance and the 100 hourly simple moving average. The price traded to a new weekly high at $9,779 and recently started a downside correction.
It traded below the $9,700 and $9,680 levels. Besides, there was a break below the 23.6% Fib retracement level of the recent wave from the $9,282 low to $9,779 high. Bitcoin price tested the $9,600 region, where it found a strong buying interest.
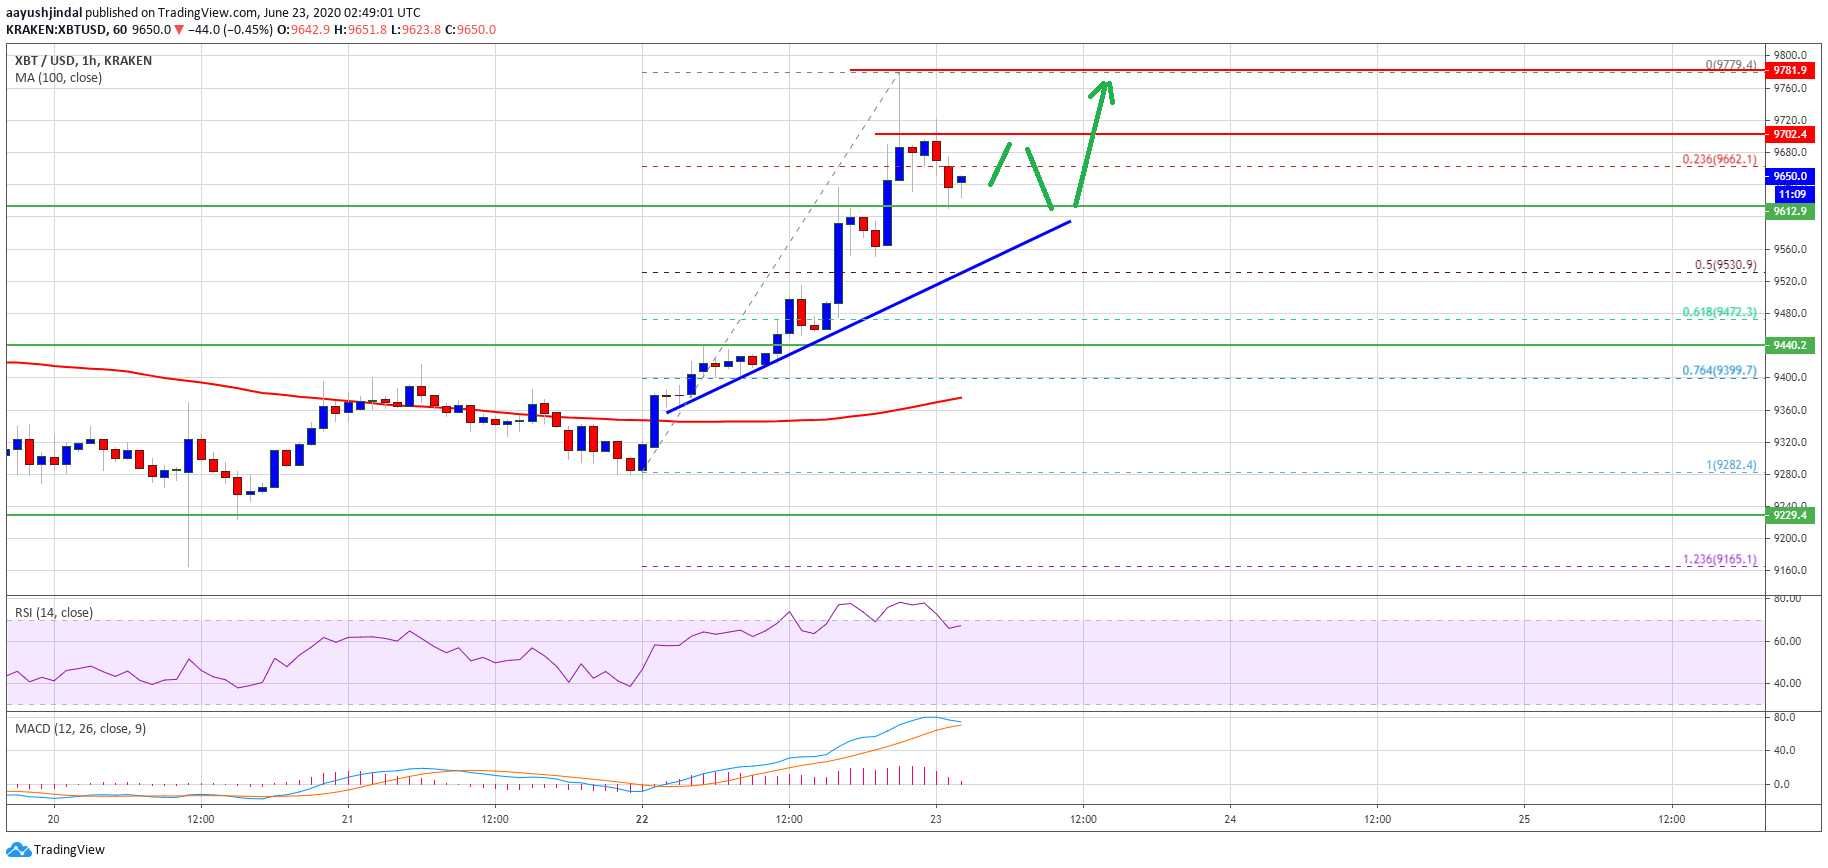
Bitcoin Price Breaks $9,500: Source: TradingView.com
More importantly, there is a crucial bullish trend line forming with support near $9,600 on the hourly chart of the BTC/USD pair. If the price breaks the trend line support, it could test the $9,530 level or the 50% Fib retracement level of the recent wave from the $9,282 low to $9,779 high.
On the upside, an initial resistance is near the $9,700 level. The main resistance is now near the $9,800 level, above which the price is likely to test the $9,950 and $10,000 resistance levels in the near term.
Dips Supported in BTC
On the downside, there are many supports forming, starting at $9,600. The key uptrend support is now near the $9,500 level (the recent breakout zone).
If bitcoin declines below the $9,500 support, it could continue to move down towards the $9,350 level or the 100 hourly simple moving average in the coming sessions. Any further losses could lead it towards the $9,282 swing low.
Technical indicators:
Hourly MACD – The MACD is currently losing momentum in the bullish zone.
Hourly RSI (Relative Strength Index) – The RSI for BTC/USD is now correcting lower from well above the 70 level.
Major Support Levels – $9,600, followed by $9,500.
Major Resistance Levels – $9,700, $9,800 and $10,000.


