
Reason to trust
How Our News is Made
Strict editorial policy that focuses on accuracy, relevance, and impartiality
Ad discliamer
Morbi pretium leo et nisl aliquam mollis. Quisque arcu lorem, ultricies quis pellentesque nec, ullamcorper eu odio.
Bitcoin is trading above the $9,150 support against the US Dollar. BTC seems to be preparing for a major increase if it succeeds in clearing the $9,200 resistance zone.
- Bitcoin is still struggling to settle above the $9,200 and $9,220 resistance levels.
- The price is currently trading above the $9,150 support and the 100 hourly simple moving average.
- There is a crucial bullish trend line forming with support near $9,155 on the hourly chart of the BTC/USD pair (data feed from Kraken).
- The pair is likely to gain bullish momentum as long as it is above the $9,150 and $9,120 support levels.
Bitcoin Price is Holding Key Supports
In the past few sessions, bitcoin made a couple of attempts to gain strength above $9,200 against the US Dollar. However, BTC struggled to settle above the $9,200 resistance and traded in a contracted range.
The last swing low was near $9,133 and the price is currently trading above the $9,150 level. It also settled above the $9,150 level and the 100 hourly simple moving average. The bulls were able to lead the price above the 23.6% Fib retracement level of the recent decline from the $9,238 high to $9,133 low.
On the upside, the bulls seem to be facing a major hurdle near the $9,200 level. The recent recovery failed to surpass the 61.8% Fib retracement level of the recent decline from the $9,238 high to $9,133 low.
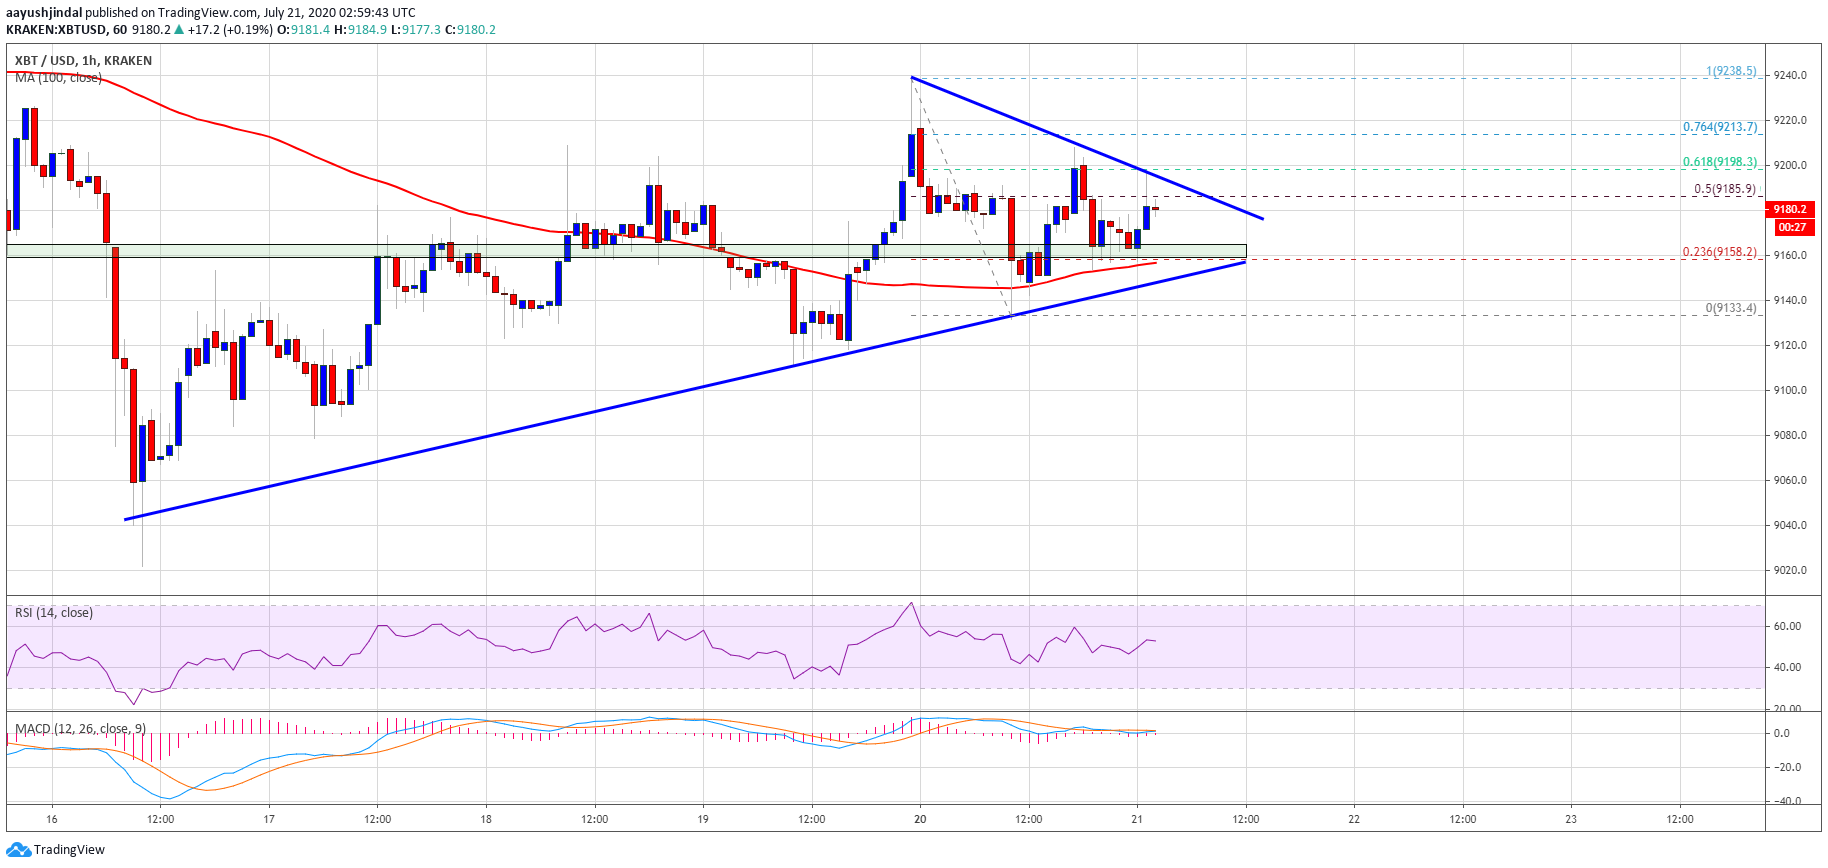
Bitcoin price holding $9,000: Source: TradingView.com
There is also a connecting bearish trend line forming with resistance near $9,185 on the hourly chart of the BTC/USD. If the pair breaks the trend line resistance and settles above $9,200, it could continue to climb. The next resistance is near the $9,300 level, above which the next stop could be $9,500 or $9,550.
BTC’s Breakdown Support
On the downside, there is a crucial bullish trend line forming with support near $9,155 on the same chart. The trend line support is close to the 100 hourly SMA.
If there is a bearish break below the $9,150 support and the 100 hourly SMA, the bulls are likely to face an increase in selling pressure. Any further losses below $9,120 could push the price towards the main $9,000 support.
Technical indicators:
Hourly MACD – The MACD is currently losing momentum in the bullish zone.
Hourly RSI (Relative Strength Index) – The RSI for BTC/USD is just above the 50 level.
Major Support Levels – $9,150, followed by $9,120.
Major Resistance Levels – $9,200, $9,240 and $9,300.


