
Reason to trust
How Our News is Made
Strict editorial policy that focuses on accuracy, relevance, and impartiality
Ad discliamer
Morbi pretium leo et nisl aliquam mollis. Quisque arcu lorem, ultricies quis pellentesque nec, ullamcorper eu odio.
Binance coin price is gaining bullish momentum above the $18.00 resistance against the USDT. BNB is trading in a nice uptrend and it could aim a break above the $18.99 monthly high.
- Binance coin price is up more than 7% and it recently broke the $18.00 resistance against the USDT.
- The price is likely to continue higher above the $18.50 and $19.00 resistance levels.
- There is a crucial bullish trend line forming with support near $17.30 on the 4-hours chart of the BNB/USDT pair (data source from Binance).
- Bitcoin could follow BNB and it might gain traction if there is a proper close above $9,200.
Binance Coin Price Gaining Momentum
This past week, binance coin declined below the $17.50 support level. BNB price even broke the $17.00 support level, but it found a strong support near the 100 simple moving average (4-hours).
A low was formed near $16.53 and the price recently started a positive upward move. It broke the $17.50 resistance zone to move into a bullish zone. More importantly, there was a break above the 61.8% Fib retracement level of the last key decline from the $18.99 high to $16.53 low.
It seems like there is a crucial bullish trend line forming with support near $17.30 on the 4-hours chart of the BNB/USDT pair. The pair is up more than 7% and it recently broke the $18.00 resistance.
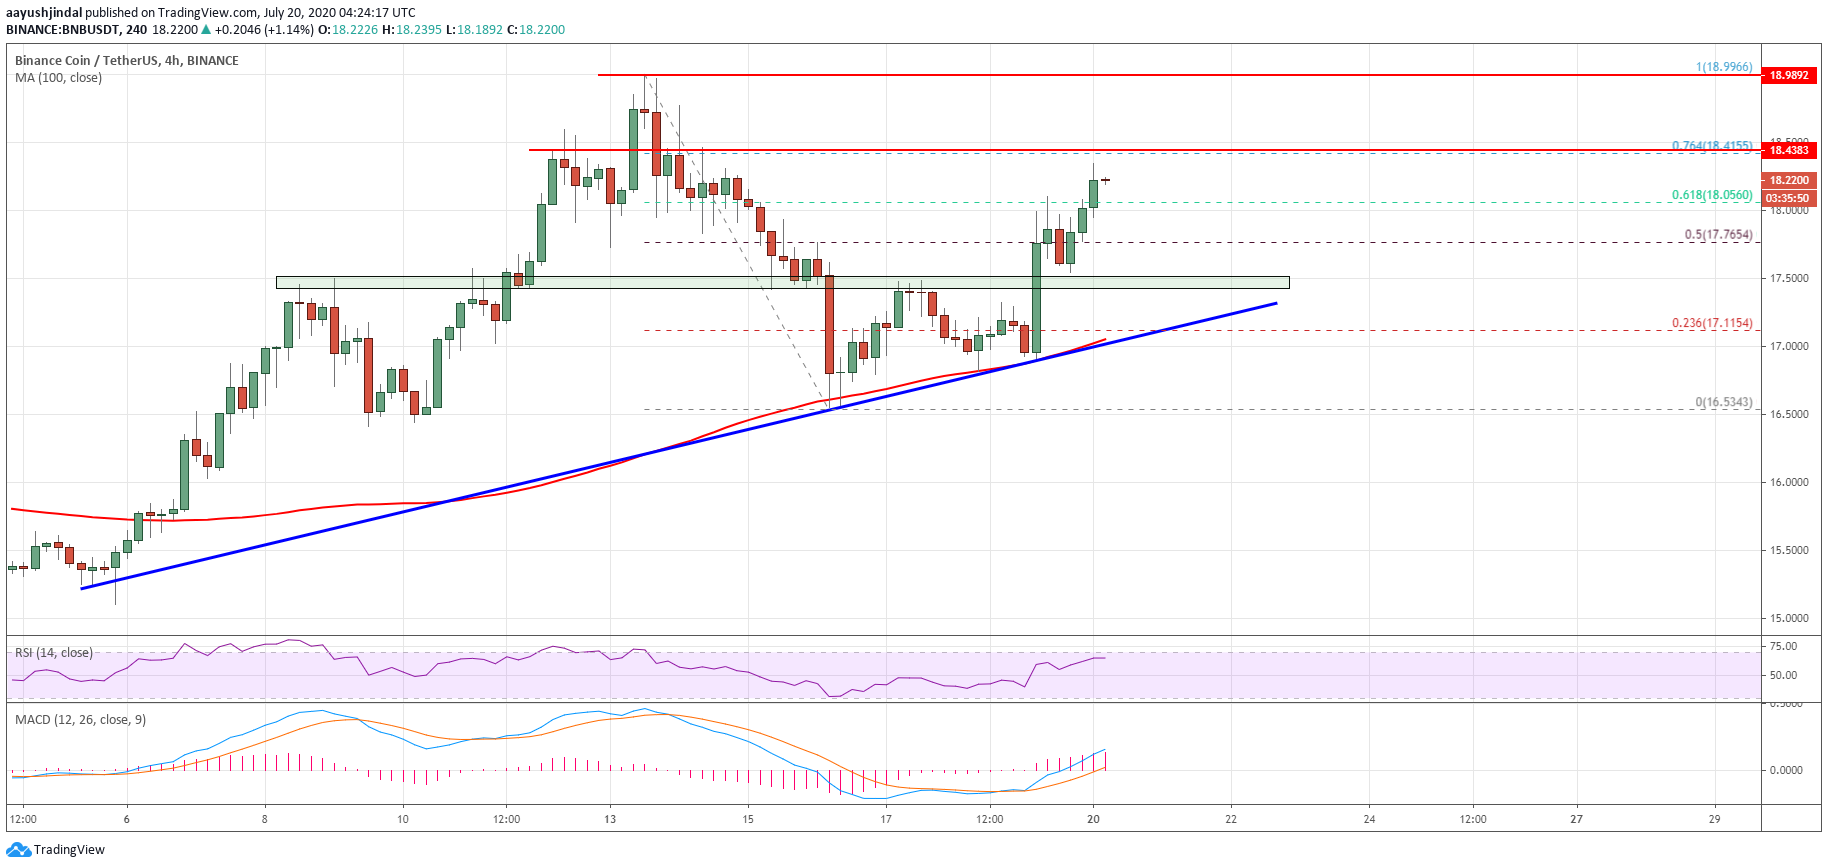
Binance coin price trades above $18.00. Source: TradingView.com
An immediate resistance is near the $18.40 level. It is close to the 76.4% Fib retracement level of the last key decline from the $18.99 high to $16.53 low. A clear break above the $18.40 and $18.50 resistance levels could open the doors for a larger rally.
The next resistance is near the $19.00 level, above which BNB might continue to rise towards the $19.80 and $20.00 resistance levels in the near term
Dips Supported in BNB
If BNB fails to clear the $18.40 and $18.50 resistance levels, it could start a downside correction. An initial support is seen near the $17.50 level (a multi-touch zone).
The main support is near the trend line, $17.20, and the 100 SMA. A close below $17.20 and $17.00 might push the price into a bearish zone.
Technical Indicators
4-Hours MACD – The MACD for BNB/USDT is gaining momentum in the bullish zone.
4-Hours RSI (Relative Strength Index) – The RSI for BNB/USDT is currently well above the 55 level.
Major Support Levels – $17.50, $17.20 and $17.00.
Major Resistance Levels – $18.40, $18.50 and $19.00.
Take advantage of the trading opportunities with Plus500
Risk disclaimer: 76.4% of retail CFD accounts lose money.


