
Reason to trust
How Our News is Made
Strict editorial policy that focuses on accuracy, relevance, and impartiality
Ad discliamer
Morbi pretium leo et nisl aliquam mollis. Quisque arcu lorem, ultricies quis pellentesque nec, ullamcorper eu odio.
Binance coin price is up over 35% and it is extended its rally above $200 against the USDT. BNB traded to a record high at $238 and it seems like there are chances of more upsides.
- Binance coin price extended its rally above the $175 and $200 resistance levels against the USDT.
- The price traded to a new all-time high at $238 and it settled well above the 100 simple moving average (4-hours).
- There was a break above a couple of bullish continuation patterns at $170 and $200 on the 4-hours chart of the BNB/USDT pair (data source from Binance).
- There is consolidating gains and it is likely to continue higher towards $250 and $275.
Binance Coin Price Rallies 35%
In the past few days, binance coin gained a strong bullish momentum above the $100 level. BNB price outperformed bitcoin and Ethereum, with massive gains.
It even broke the $150 and $175 resistance levels. During the recent rally, there was a break above a couple of bullish continuation patterns at $170 and $200 on the 4-hours chart of the BNB/USDT pair. The pair even surged above the $200 and $210 levels.
It traded to a new all-time high at $238 and it settled well above the 100 simple moving average (4-hours). BNB is currently correcting gains and testing the $225 level.
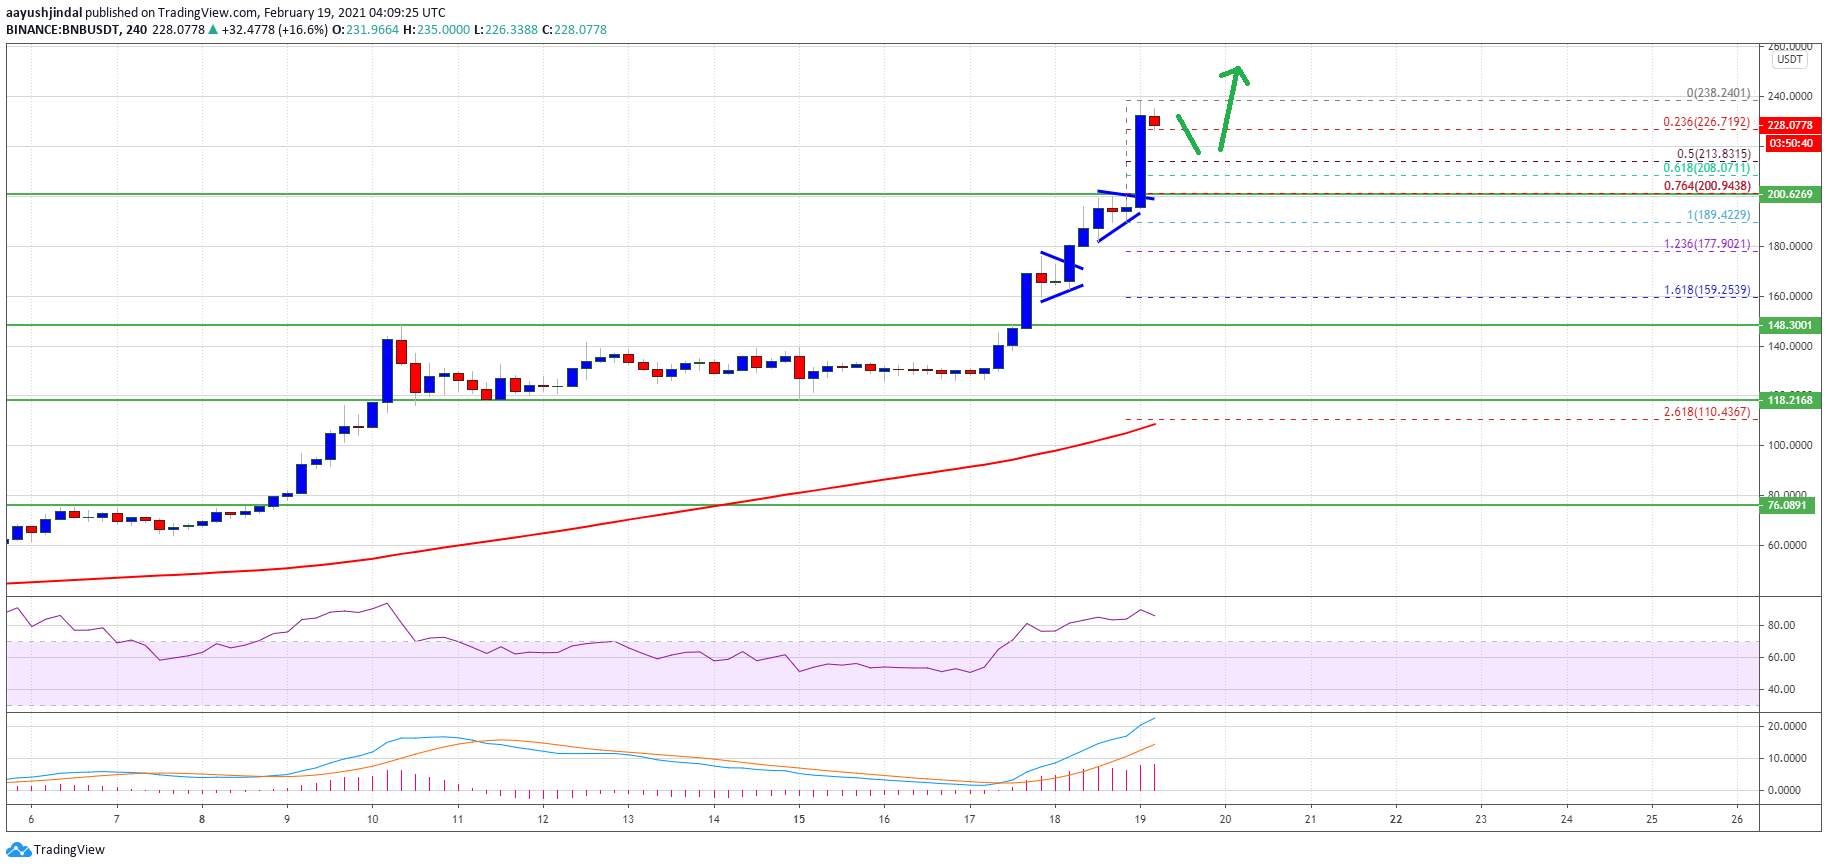
Source: BNBUSDT on TradingView.com
The 23.6% Fib retracement level of the recent rally from the $189 swing low to $238 high is acting as a strong support. If there are any more losses, the price could decline towards the $210 level.
On the upside, the $240 level is a short-term hurdle. The next major resistance is near the $250 level. A clear break above the $250 level will most likely open the doors for a sharp increase towards the $285 and $300 levels in the near term.
Dips Supported in BNB?
If BNB fails to continue higher above $240 and $250, there could be a downside correction. The first major support is near the $225 level.
The next major support is near the $210 level. It is close to the 50% Fib retracement level of the recent rally from the $189 swing low to $238 high. Any more losses might call for a test of $200.
Technical Indicators
4-Hours MACD – The MACD for BNB/USDT is gaining momentum in the bullish zone.
4-Hours RSI (Relative Strength Index) – The RSI for BNB/USDT is currently in the overbought zone.
Major Support Levels – $225, $210 and $200.
Major Resistance Levels – $240, $250 and $300.


