
Reason to trust
How Our News is Made
Strict editorial policy that focuses on accuracy, relevance, and impartiality
Ad discliamer
Morbi pretium leo et nisl aliquam mollis. Quisque arcu lorem, ultricies quis pellentesque nec, ullamcorper eu odio.
Binance coin price corrected sharply lower towards the $200 support against the USDT. BNB is consolidating and it is likely to rally again above $250 and $280.
- Binance coin price started a strong decline from a new all-time high at $348 against the USDT.
- The price declined over $100, but it remained stable above the 100 simple moving average (4-hours).
- There is a major contracting triangle pattern forming with resistance near $250 on the 4-hours chart of the BNB/USDT pair (data source from Binance).
- The pair could start another rally if there is a clear break above $250 and $280.
Binance Coin Price Holding Key Support
There was an upside extension in binance coin above the $250 and $300 levels. BNB price even broke the $320 level and traded to a new all-time high at $348.
Recently, there was a sharp decline in bitcoin, ethereum, and altcoins. BNB also corrected lower sharply and broke a couple of important support at $300. It even broke the $250 support level and spiked below the $200 zone.
A low was formed near $187 before there was a strong recovery. The price climbed above $250, but it failed to gain strength for a push above $300. A high is formed near $280 and the price is currently consolidating. It traded below the 50% Fib retracement level of the recent wave from the $187 swing low to $280 high.
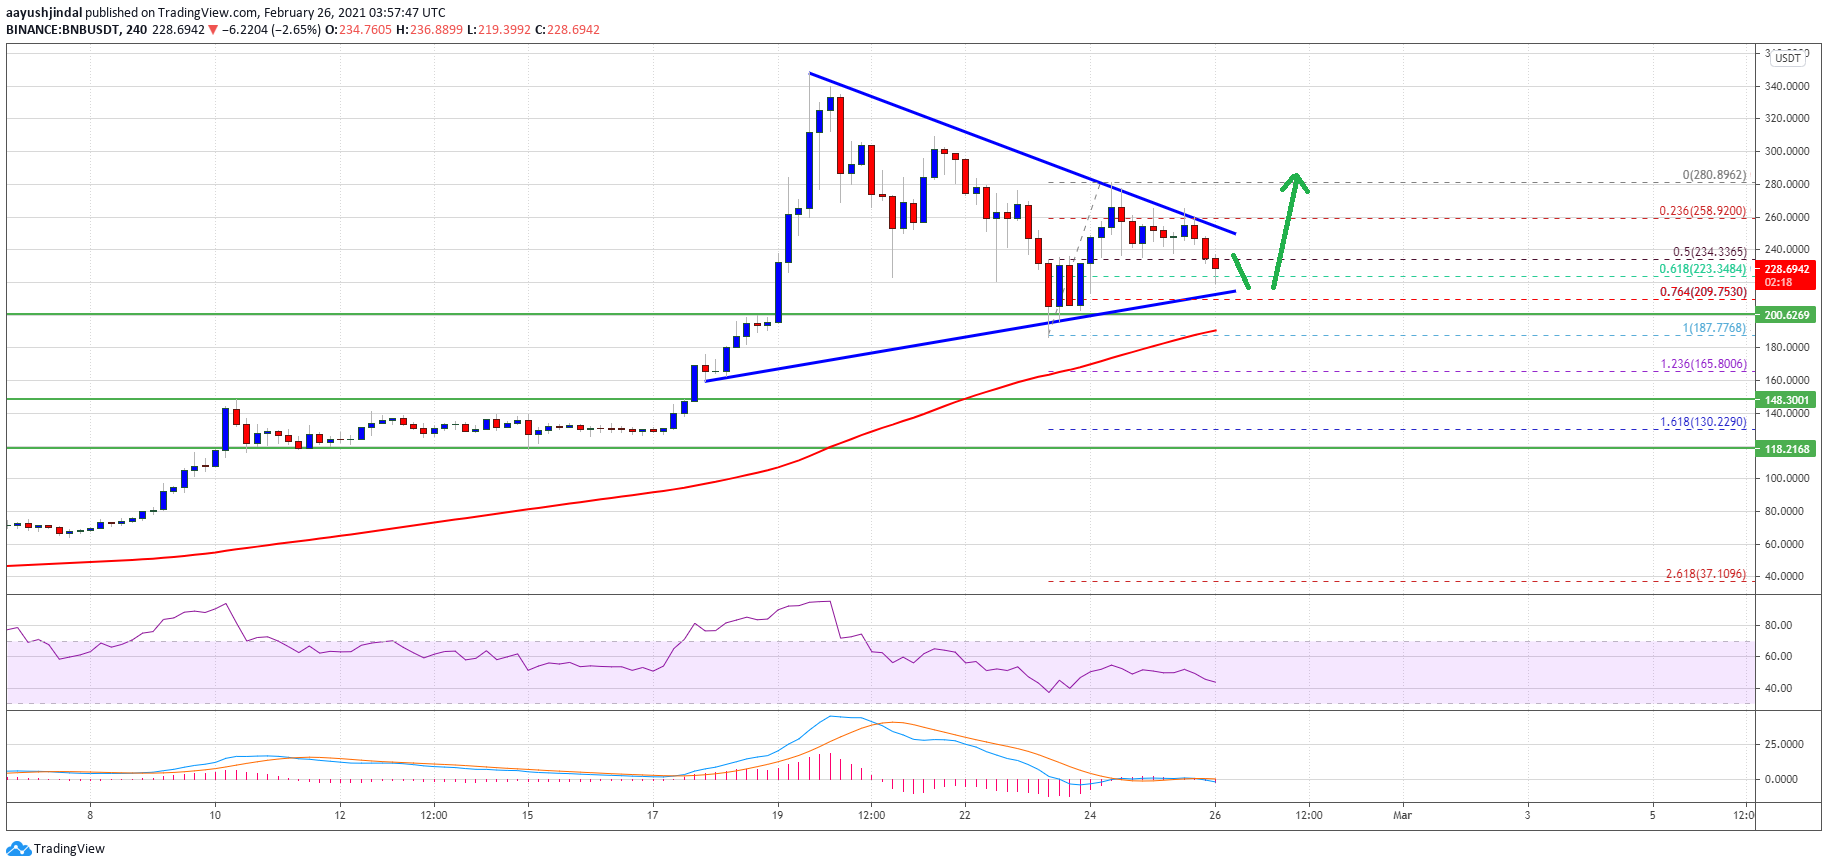
Source: BNBUSDT on TradingView.com
An initial support is near the $225 level. It is close to the 61.8% Fib retracement level of the recent wave from the $187 swing low to $280 high. It seems like there is a major contracting triangle pattern forming with resistance near $255 on the 4-hours chart of the BNB/USDT pair.
A clear upside break above the triangle resistance and $260 could open the doors for a fresh increase. The next key resistance is near the $280 level. The main barrier is at $300, above which the price could surge towards $350.
Dips Supported in BNB?
If BNB fails to continue higher above $255 and $260, there could be a fresh downside correction. The first major support is near the $225 level.
The next major support is near the $210 level or the triangle trend line. A downside break below the triangle support and $200 might call for a sharp decline towards the $150 support.
Technical Indicators
4-Hours MACD – The MACD for BNB/USDT is slowly moving in the bullish zone.
4-Hours RSI (Relative Strength Index) – The RSI for BNB/USDT is currently close to the 50 level.
Major Support Levels – $225, $210 and $200.
Major Resistance Levels – $250, $260 and $280.


