
Reason to trust
How Our News is Made
Strict editorial policy that focuses on accuracy, relevance, and impartiality
Ad discliamer
Morbi pretium leo et nisl aliquam mollis. Quisque arcu lorem, ultricies quis pellentesque nec, ullamcorper eu odio.
Binance coin price is up over 5% and it is outperforming bitcoin against the USDT. BNB could rally further to a new monthly high if it breaks the $24.00 resistance zone.
- Binance coin price is gaining bullish momentum above the $22.80 resistance against the USDT.
- The price is approaching a key resistance near the $23.75 and $24.00 resistance levels.
- There is a crucial bearish trend line forming with resistance near $23.80 on the 4-hours chart of the BNB/USDT pair (data source from Binance).
- Bitcoin price is still struggling to recover and it remains at a risk of a sharp decline.
Binance Coin Price Showing Positive Signs
In the past few sessions, bitcoin and Ethereum struggled to recover, while binance coin started a fresh increase. BNB price broke the $22.00 resistance and remained stable above the $21.50 support zone.
There was a close above the $21.80 level, the 100 simple moving average (4-hours), and the 50% Fib retracement level of the downward move from the $25.57 high to $18.03 low. BNB is now trading above the $23.00 level, with a positive angle.
At the outset, the price is approaching a key resistance near the $23.75 and $24.00 resistance levels. There is also a crucial bearish trend line forming with resistance near $23.80 on the 4-hours chart of the BNB/USDT pair.
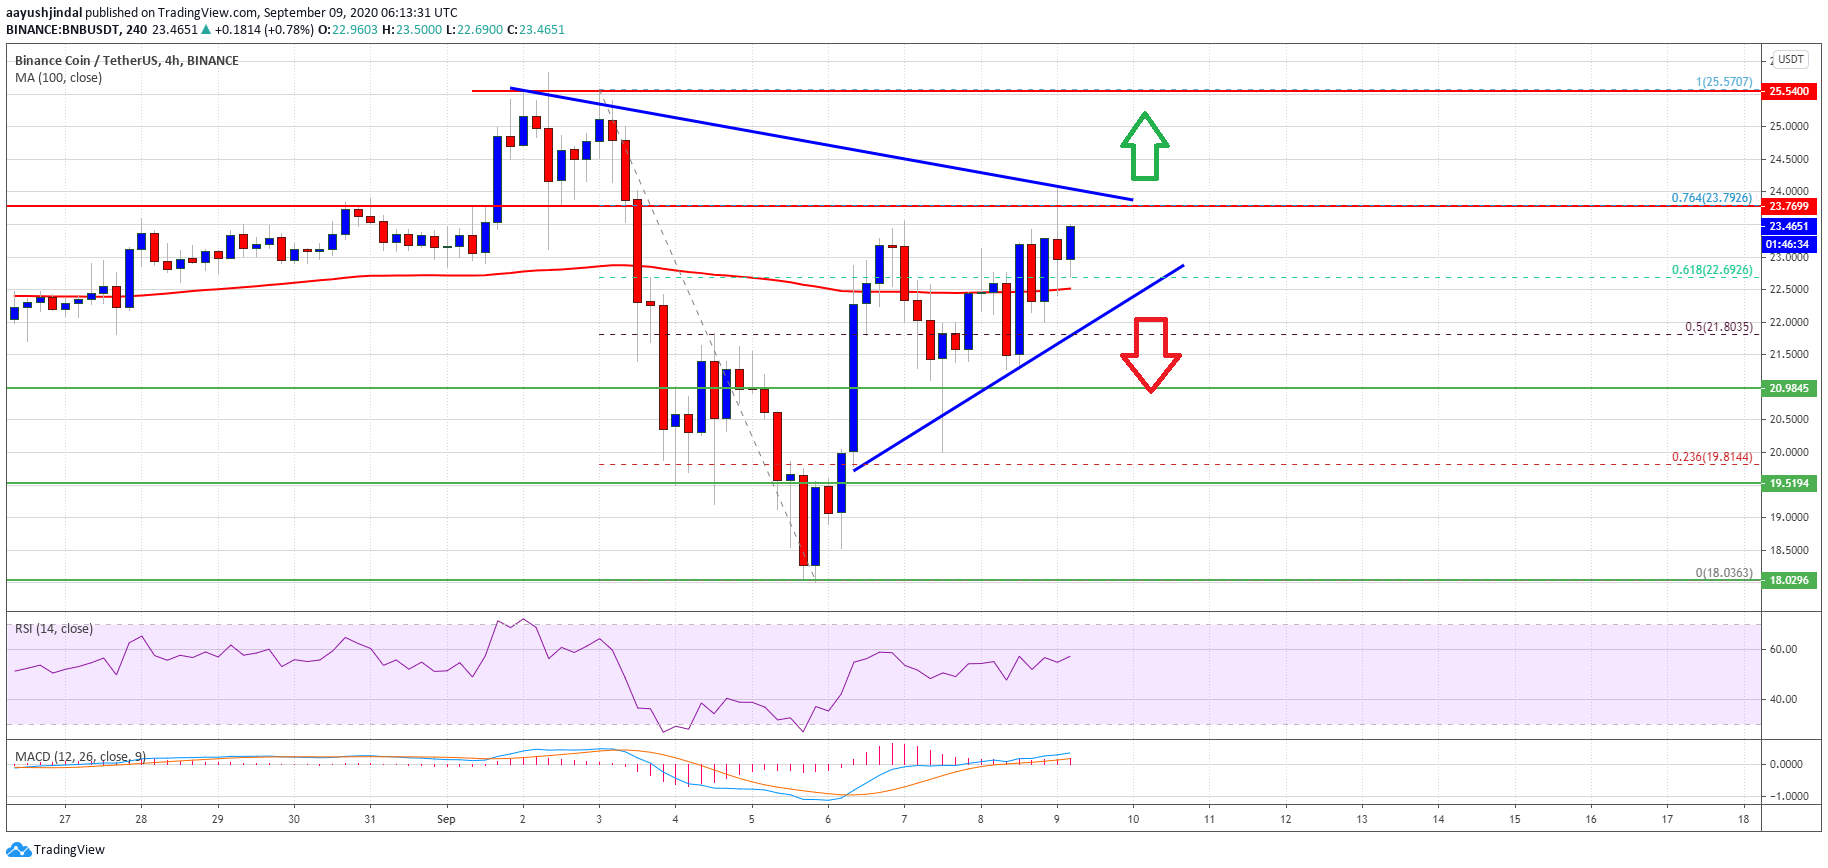
Binance coin price trades above $23.00. Source: TradingView.com
The trend line is close to the 76.4% Fib retracement level of the downward move from the $25.57 high to $18.03 low. A clear break above the trend line resistance and the $24.00 barrier could start a strong increase in the coming sessions.
The next major resistance is near the $25.00 level, above which the price is likely to attempt a fresh multi-week high above the $25.60 resistance zone.
Dips Supported in BNB
If BNB fails to clear the $23.75 and $24.00 resistance levels, it could start a downside correction. An initial support is near the $22.65 level and a connecting bullish trend line.
The first major support is near the $22.50 level and the 100 simple moving average (4-hours), below which the bulls are likely to lose control. In the stated case, the price might slide back towards the $21.00 and $20.80 support levels.
Technical Indicators
4-Hours MACD – The MACD for BNB/USDT is gaining momentum in the bullish zone.
4-Hours RSI (Relative Strength Index) – The RSI for BNB/USDT is currently well above the 50 level.
Major Support Levels – $22.60, $22.50 and $21.00.
Major Resistance Levels – $23.75, $24.00 and $25.00.


