
Reason to trust
How Our News is Made
Strict editorial policy that focuses on accuracy, relevance, and impartiality
Ad discliamer
Morbi pretium leo et nisl aliquam mollis. Quisque arcu lorem, ultricies quis pellentesque nec, ullamcorper eu odio.
Binance coin price started a fresh rally above the $250 resistance against the USDT. BNB is gaining momentum and it is likely to clear the $300 barrier in the near term.
- Binance coin price started a fresh rally above the $250 and $260 resistance levels against the USDT.
- The price is now trading well above $260 and the 100 simple moving average (4-hours).
- There is a key bullish trend line forming with support near $245 on the 4-hours chart of the BNB/USDT pair (data source from Binance).
- The pair is likely to resume its upward move above the $285 and $290 resistance levels in the near term.
Binance Coin Price Revisit $300
After forming a base above $200, binance coin started a fresh increase. BNB broke the $220 resistance and recently surpassed the main $250 resistance zone.
It opened the doors for a sharp rally above the $275 and $285 resistance levels. The price traded as high as $297 and is currently correcting lower. BNB declined below the 23.6% Fib retracement level of the upward move from the $214 low to $297 high.
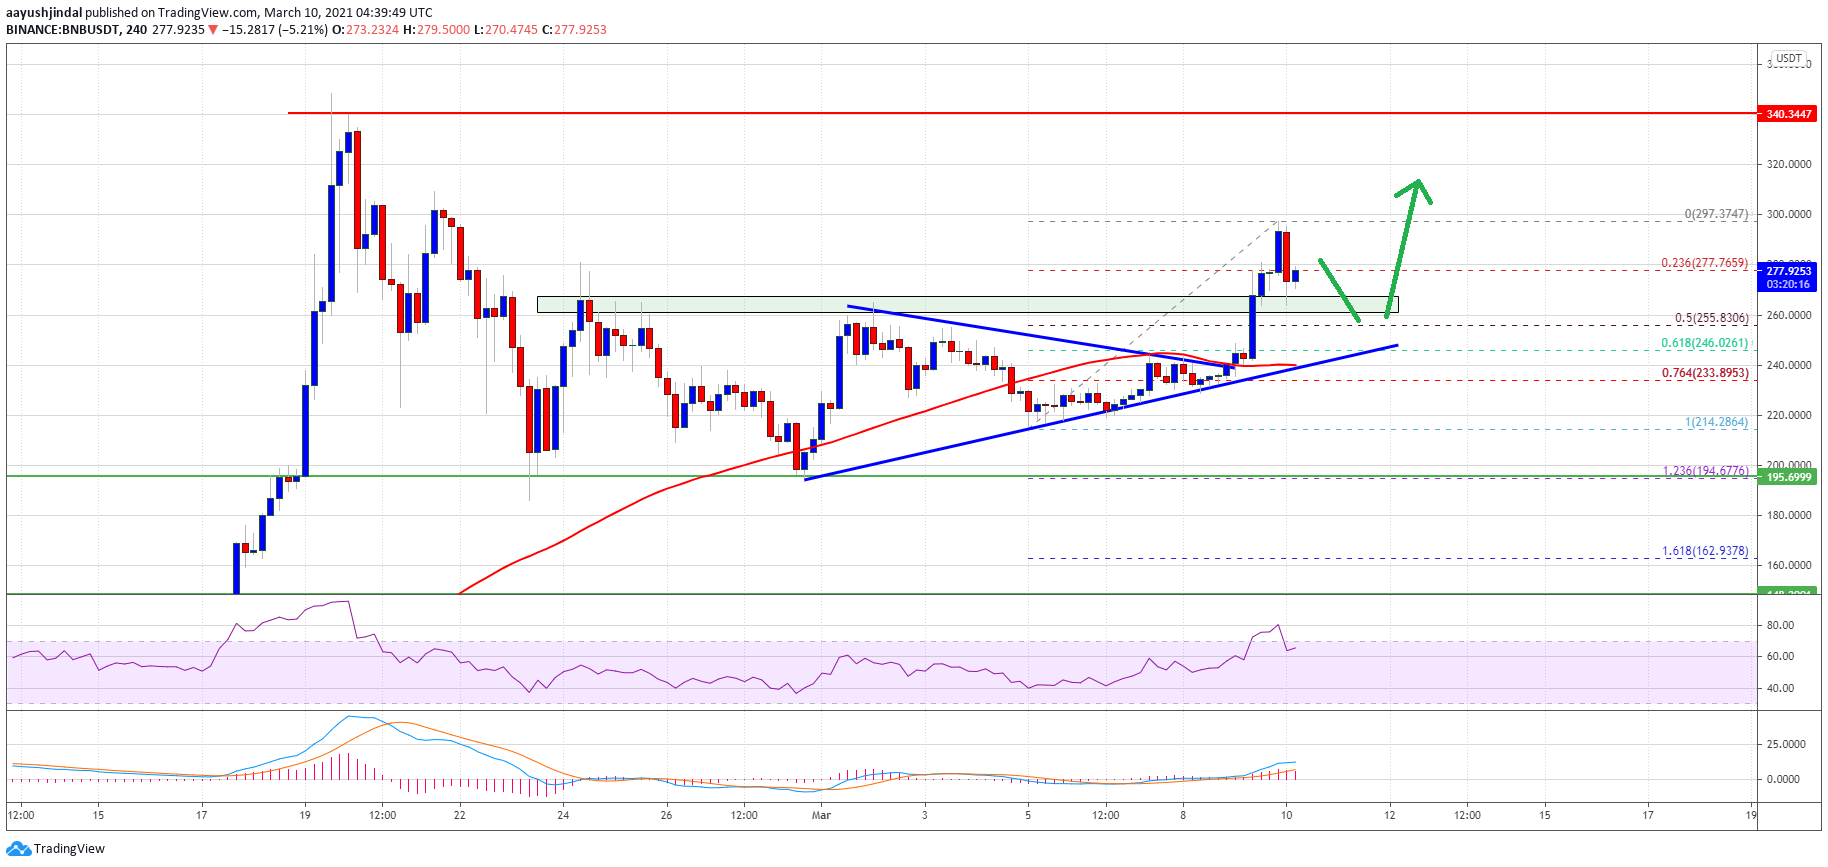
Source: BNBUSDT on TradingView.com
It is still trading well above $260 and the 100 simple moving average (4-hours). The bulls are protecting the $265 and $260 support levels. The next major support is near the $255 level. It is close to the 50% Fib retracement level of the upward move from the $214 low to $297 high.
There is also a key bullish trend line forming with support near $245 on the 4-hours chart of the BNB/USDT pair. On the upside, the bulls are facing resistance near the $285 and $290 levels. The main resistance is still near the $300 level, above which the price is likely to accelerate higher in the near term.
Dips Supported in BNB?
If BNB fails to continue higher above $285 and $295, there could be a fresh downside correction. The first major support is near the $255 level.
The next major support is near the $245 level and the trend line. If there is a downside break below the trend line support, there could be a drop towards the $220 support zone.
Technical Indicators
4-Hours MACD – The MACD for BNB/USDT is gaining pace in the bullish zone.
4-Hours RSI (Relative Strength Index) – The RSI for BNB/USDT is currently well above the 50 level.
Major Support Levels – $265, $255 and $245.
Major Resistance Levels – $285, $295 and $300.


