

Los datos en cadena muestran que Solana (SOL) ha visto su valor spot caer por debajo del Precio Realizado por primera vez en tres años después de la reciente acción bajista.
Solana acaba de ver una ruptura del Precio Realizado
Según los datos de la firma de análisis en cadena Glassnode, Solana ha caído alrededor del 8% por debajo de su Precio Realizado. El “Precio Realizado” es un indicador que básicamente nos indica la base de costo del inversionista o dirección promedio en una red determinada.
Cuando el precio spot del activo está por encima de esta métrica, significa que los holders en general tienen una ganancia no realizada neta. Por otro lado, cuando está por debajo de este indicador, sugiere que el inversionista promedio está en pérdidas.
Ahora, aquí está el gráfico compartido por la firma de análisis que muestra la tendencia en el Precio Realizado de Solana durante los últimos años:

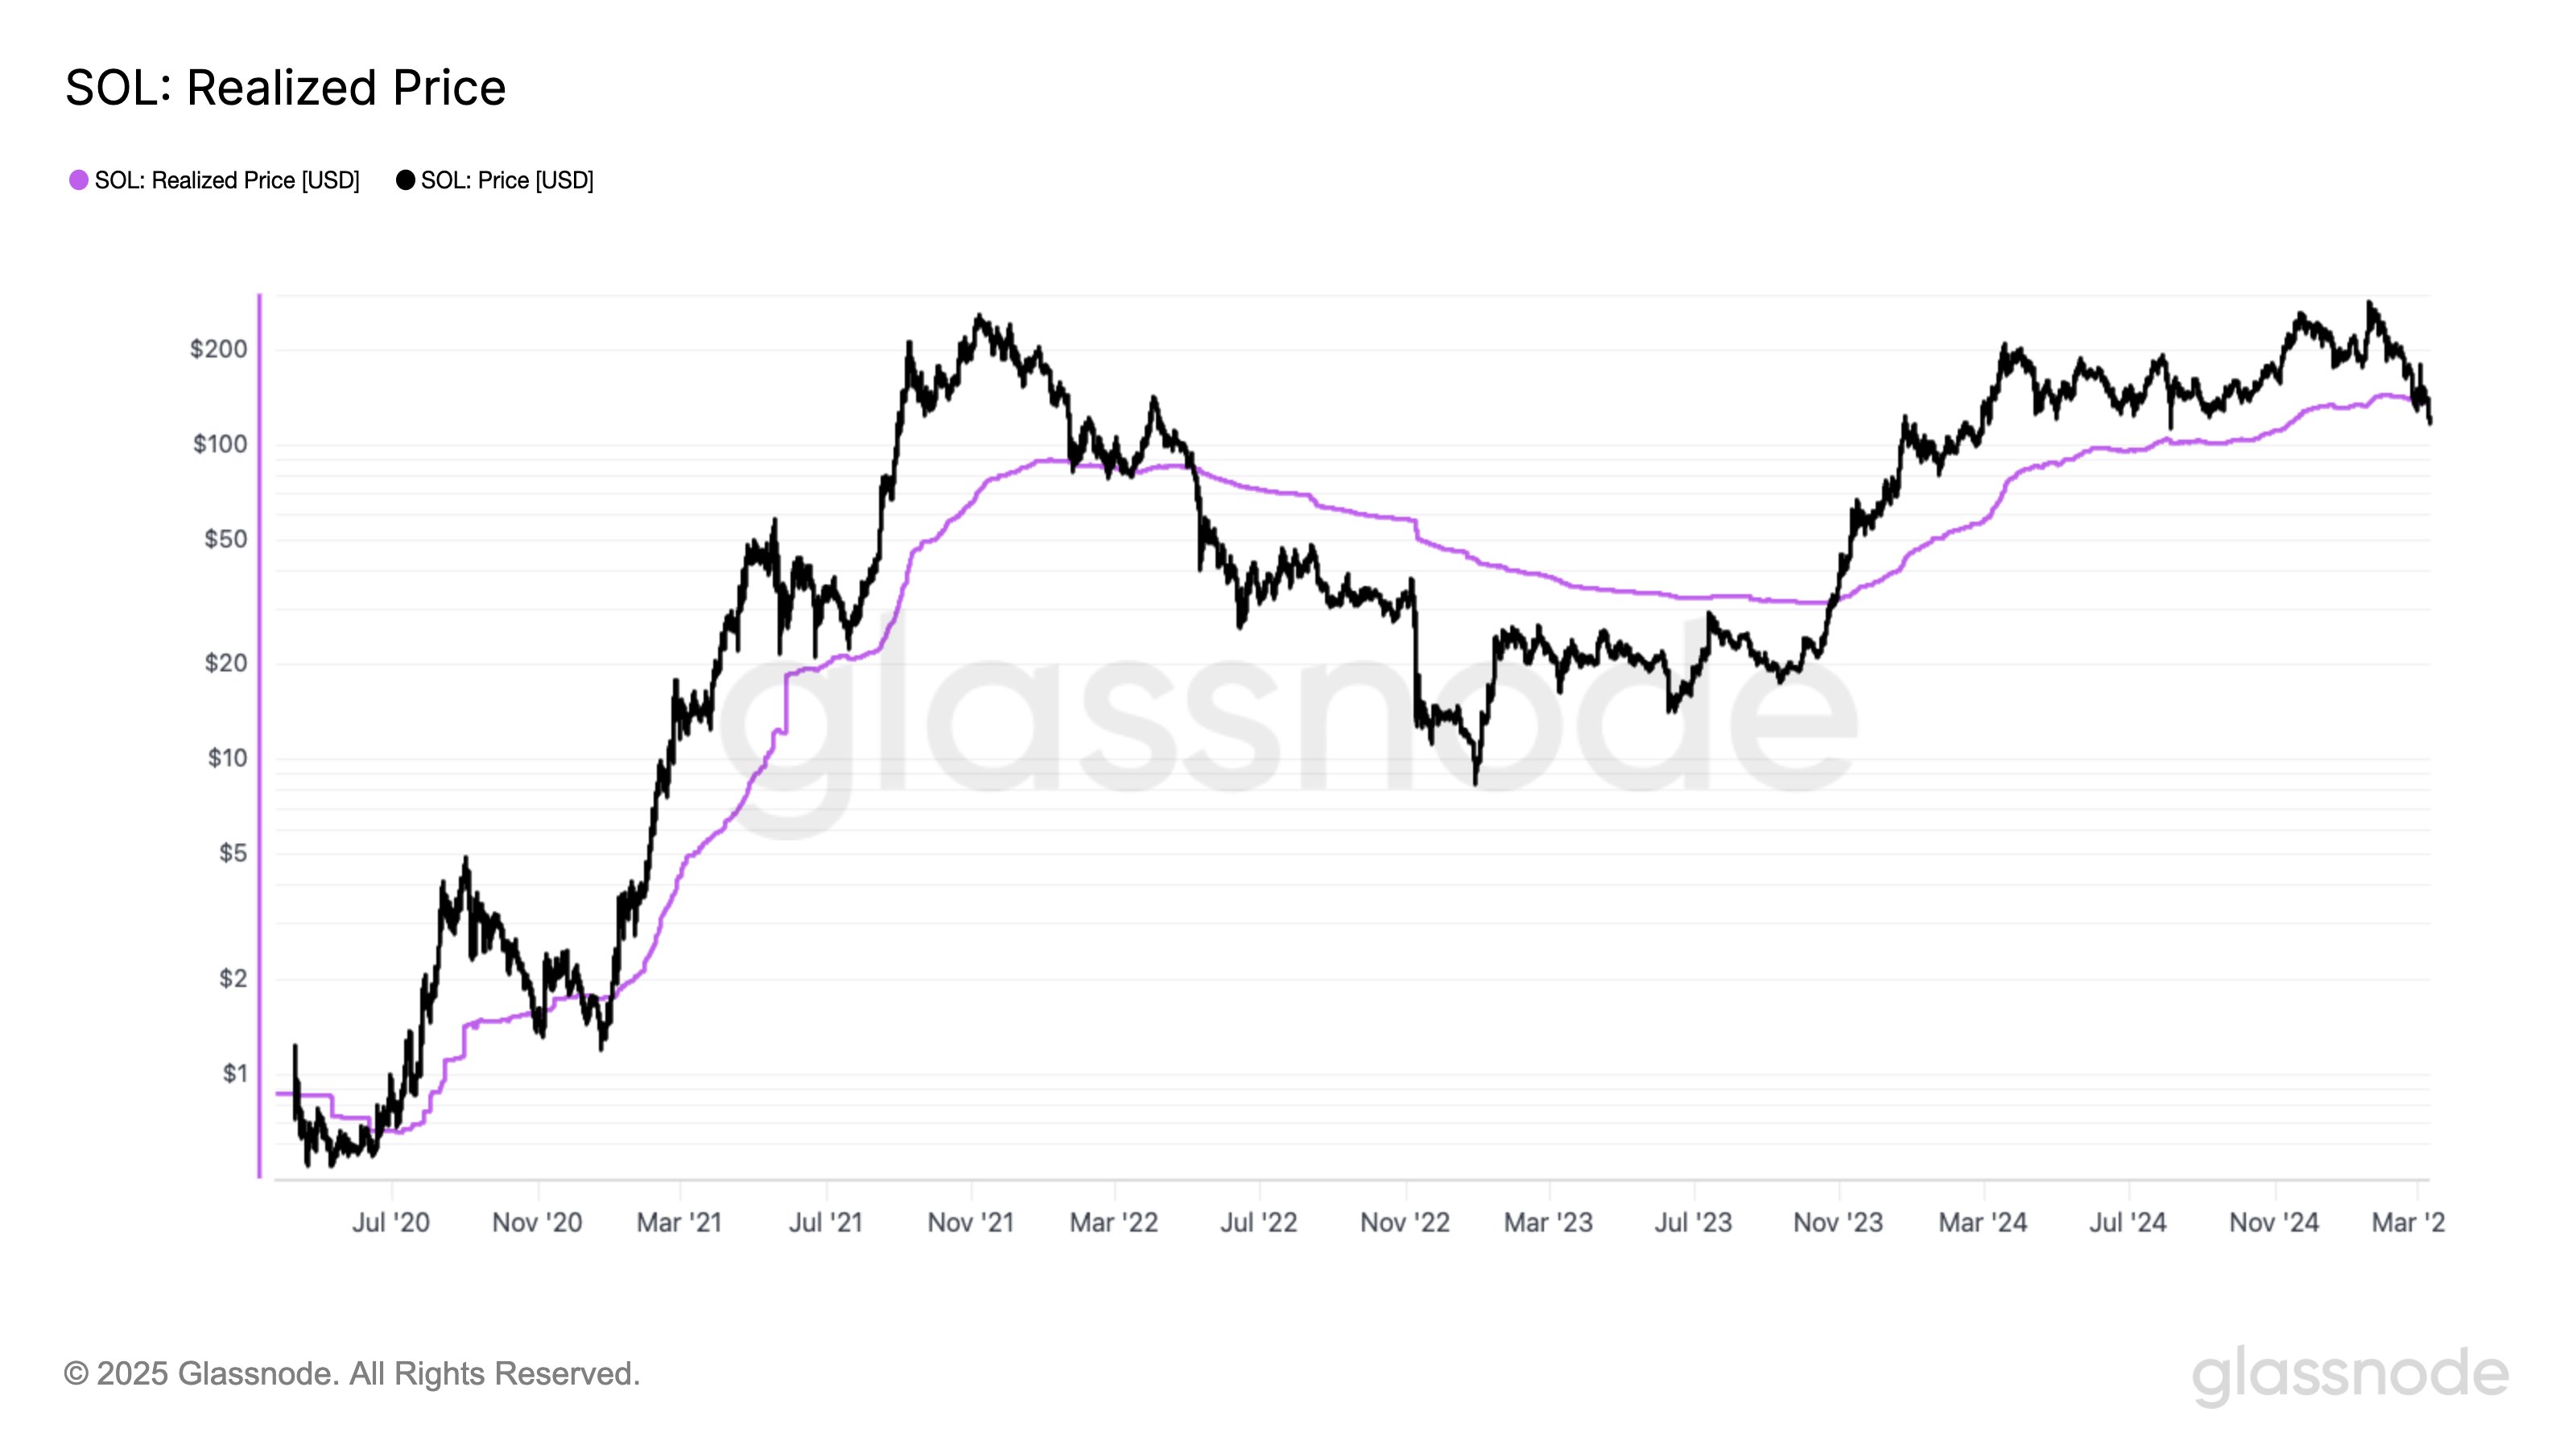
Como se puede ver en el gráfico anterior, SOL superó su Precio Realizado a finales de 2023, lo que puso a los inversionistas en terreno positivo. A lo largo de 2024 y los primeros meses de este año, el precio permaneció por encima de la línea, pero recientemente, parece que se ha producido otro cruce.
“Solana acaba de caer por debajo de su Precio Realizado por primera vez en casi 3 años”, señala Glassnode. Al tipo de cambio actual, el precio está alrededor del 8% por debajo de esta métrica, lo que significa que el holder promedio del activo podría estar en pérdidas del 8%.
En el gráfico, es evidente que la última vez que la criptomoneda vio este tipo de cruce fue en 2022. Perder este nivel en ese entonces significó el inicio de un mercado bajista. Por lo tanto, es posible que la última ruptura de la línea también sea una mala señal para la moneda esta vez.
Históricamente, el Precio Realizado ha jugado el papel de un límite entre tendencias bajistas y alcistas no solo para SOL, sino también para otros activos digitales. En otra publicación en X, Glassnode ha compartido los datos para una versión del indicador para Bitcoin, la criptomoneda número uno.
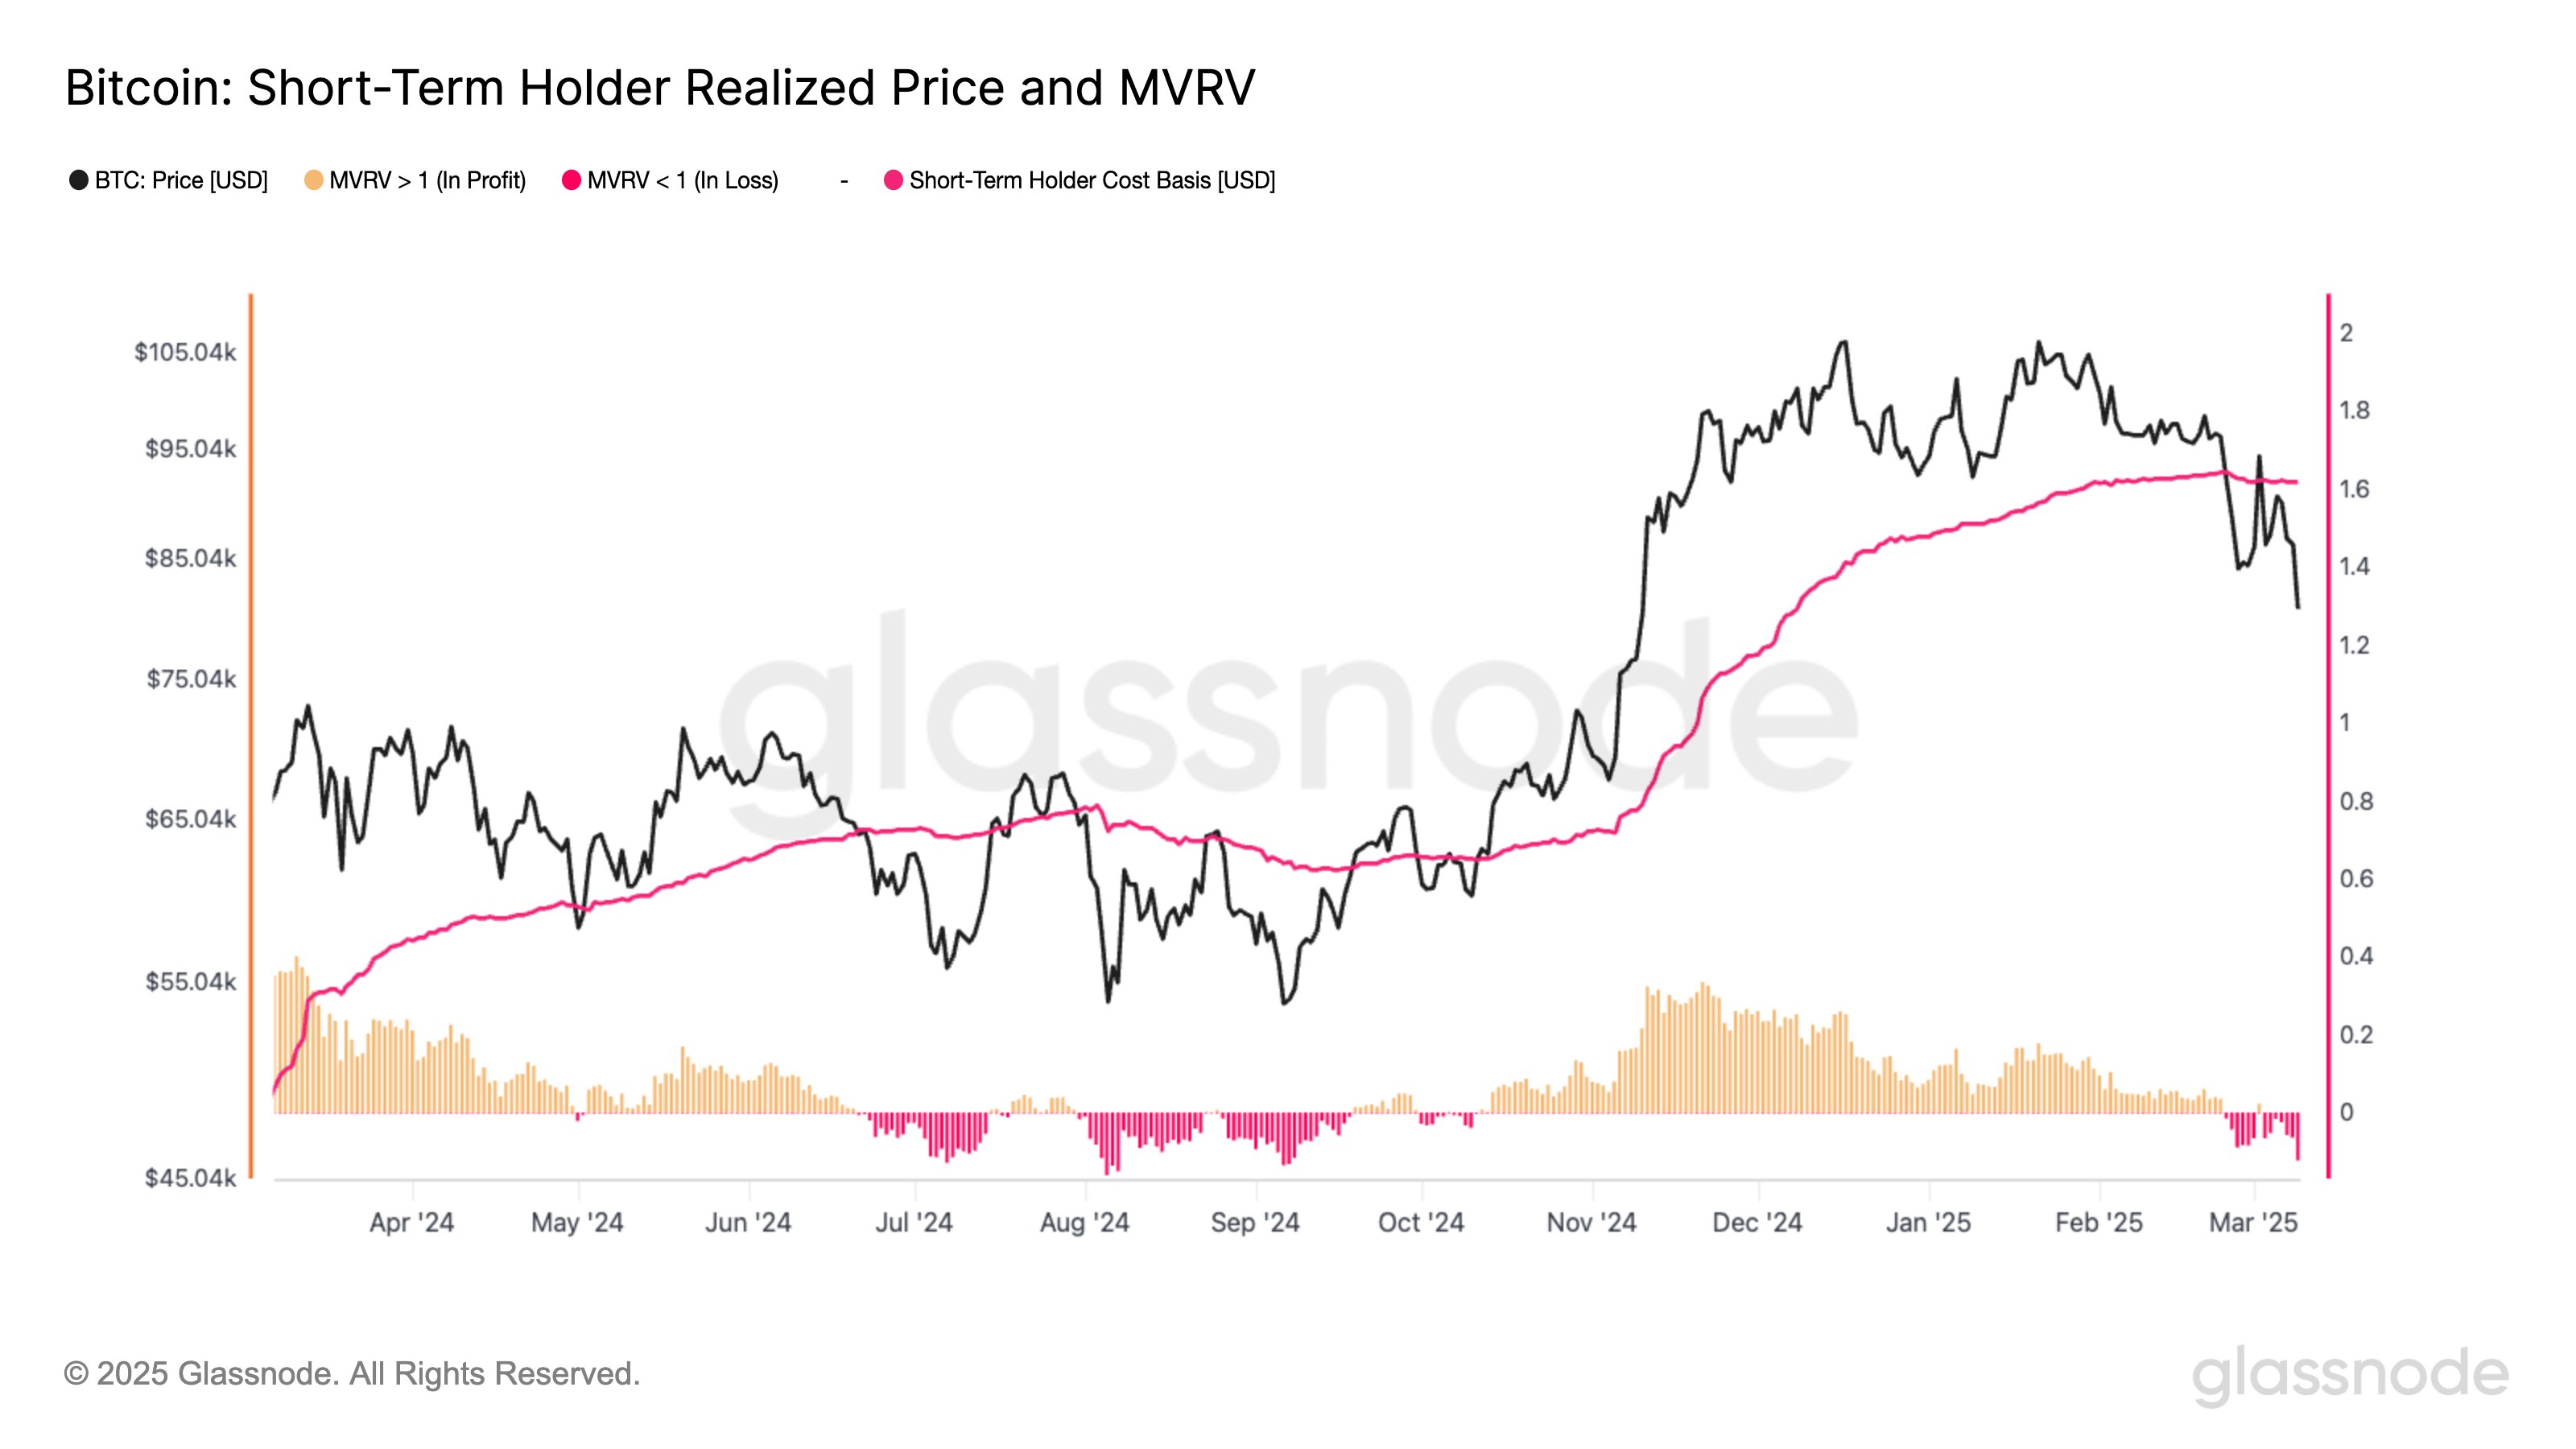
El indicador mostrado en el gráfico es el Precio Realizado de los holders a corto plazo, que solo mide la base de costo promedio de los inversionistas que compraron sus monedas en los últimos 155 días. A diferencia del Precio Realizado de toda la red, esta versión del indicador sirve más como una línea de límite para los cambios de momentum a corto plazo.
Después de la reciente acción bajista en el sector de activos digitales, Bitcoin ha visto caer a sus holders a corto plazo en pérdidas, lo que podría implicar que el activo siga sufriendo una caída en el futuro cercano.
Precio de SOL
Al momento de escribir, Solana se cotiza alrededor de $124, lo que representa una caída de casi el 9% en la última semana.
