Reason to trust
How Our News is Made
Strict editorial policy that focuses on accuracy, relevance, and impartiality
Ad discliamer
Morbi pretium leo et nisl aliquam mollis. Quisque arcu lorem, ultricies quis pellentesque nec, ullamcorper eu odio.
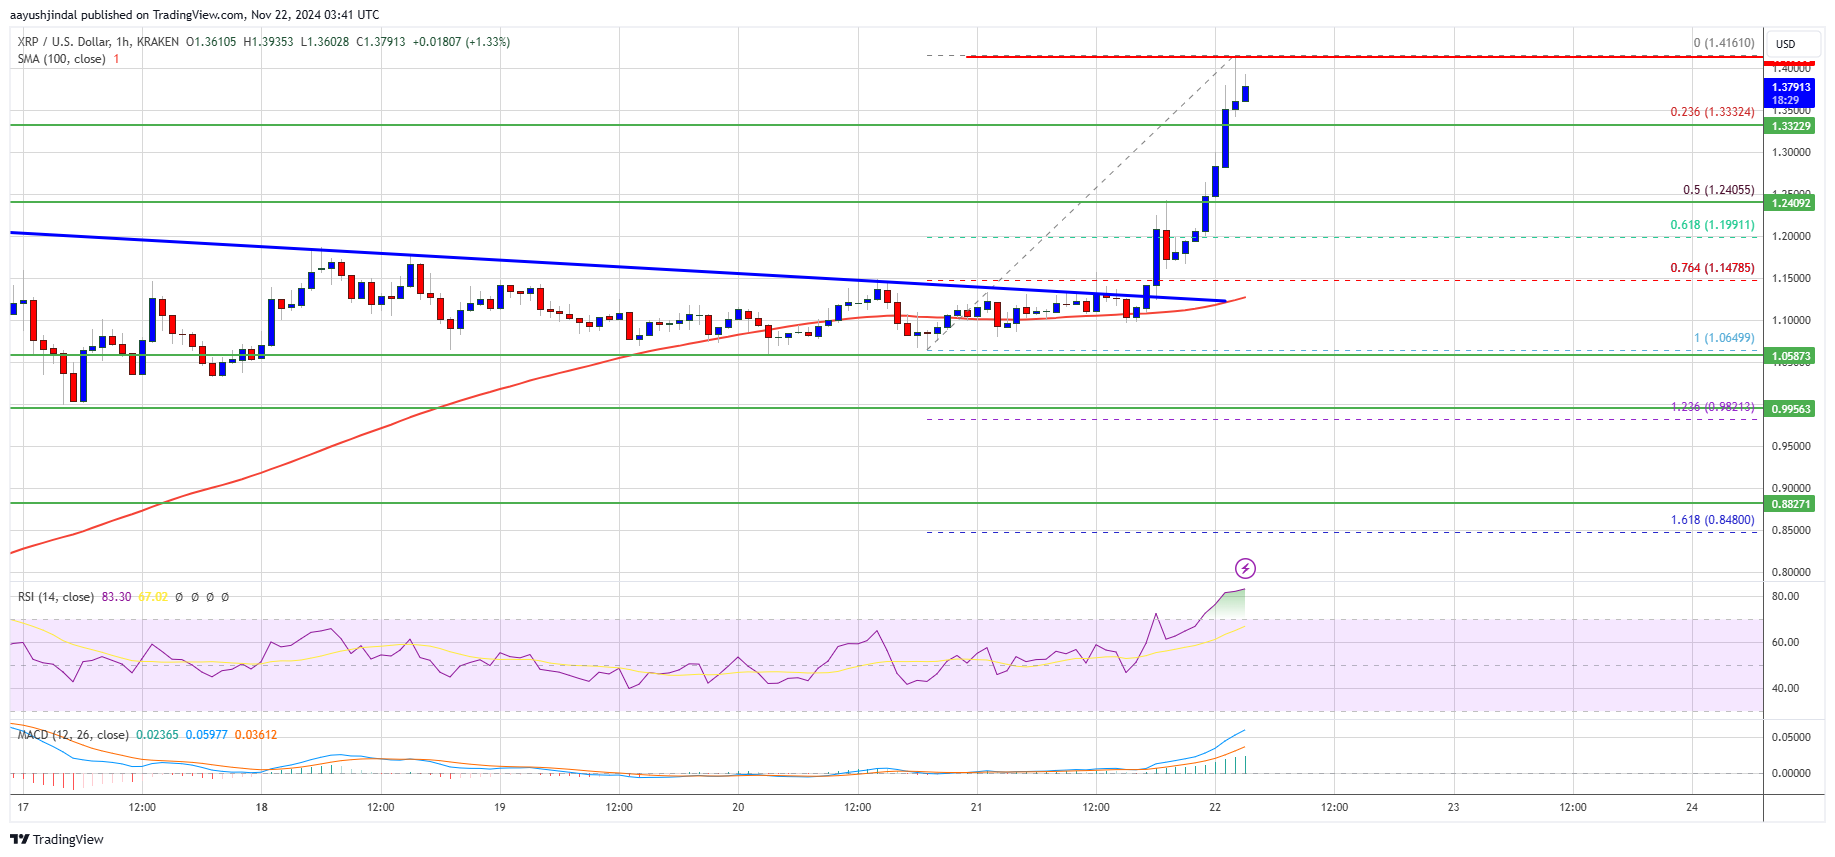
XRP price rallied above the $1.15 and $1.20 resistance levels. The price is up over 25% and might rise further above the $1.420 resistance.
- XRP price started a fresh surge above the $1.20 resistance level.
- The price is now trading above $1.250 and the 100-hourly Simple Moving Average.
- There was a break above a key bearish trend line with resistance at $1.1400 on the hourly chart of the XRP/USD pair (data source from Kraken).
- The pair is up over 25% and it seems like the bulls are not done yet.
XRP Price Eyes Steady Increase
XRP price formed a base above $1.050 and started a fresh increase. There was a move above the $1.150 and $1.20 resistance levels. It even pumped above the $1.25 level, beating Ethereum and Bitcoin in the past two sessions.
There was also a break above a key bearish trend line with resistance at $1.1400 on the hourly chart of the XRP/USD pair. A high was formed at $1.4161 and the price is now consolidating gains. It is trading above the 23.6% Fib retracement level of the upward move from the $1.0649 swing low to the $1.4161 high.
The price is now trading above $1.30 and the 100-hourly Simple Moving Average. On the upside, the price might face resistance near the $1.400 level. The first major resistance is near the $1.420 level. The next key resistance could be $1.450.
A clear move above the $1.450 resistance might send the price toward the $1.50 resistance. Any more gains might send the price toward the $1.550 resistance or even $1.620 in the near term. The next major hurdle for the bulls might be $1.750 or $1.80.
Are Dips Supported?
If XRP fails to clear the $1.420 resistance zone, it could start a downside correction. Initial support on the downside is near the $1.3350 level. The next major support is near the $1.2850 level.
If there is a downside break and a close below the $1.2850 level, the price might continue to decline toward the $1.240 support or the 50% Fib retracement level of the upward move from the $1.0649 swing low to the $1.4161 high in the near term. The next major support sits near the $1.20 zone.
Technical Indicators
Hourly MACD – The MACD for XRP/USD is now gaining pace in the bearish zone.
Hourly RSI (Relative Strength Index) – The RSI for XRP/USD is now above the 50 level.
Major Support Levels – $1.3350 and $1.2850.
Major Resistance Levels – $1.4000 and $1.4200.