
Reason to trust
How Our News is Made
Strict editorial policy that focuses on accuracy, relevance, and impartiality
Ad discliamer
Morbi pretium leo et nisl aliquam mollis. Quisque arcu lorem, ultricies quis pellentesque nec, ullamcorper eu odio.
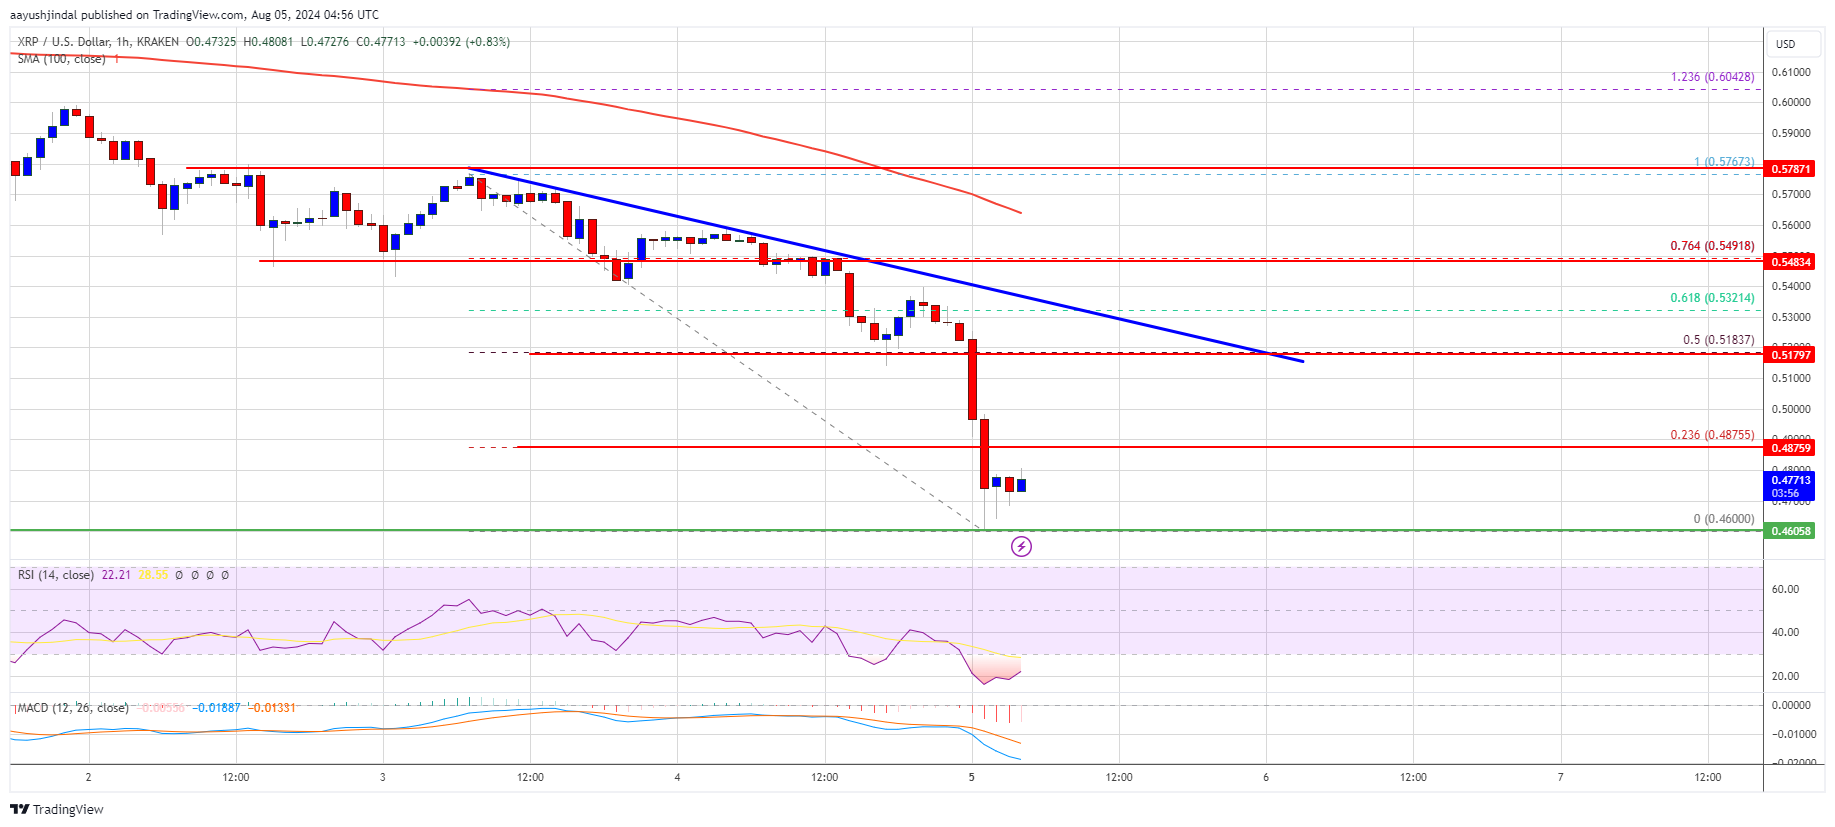
XRP price is down over 15% and trading below $0.50. The price is showing bearish signs and might struggle to recover above the $0.520 resistance.
- XRP price traded below the $0.500 and $0.4850 support levels.
- The price is now trading below $0.4880 and the 100-hourly Simple Moving Average.
- There is a key bearish trend line forming with resistance at $0.5180 on the hourly chart of the XRP/USD pair (data source from Kraken).
- The pair could attempt a steady recovery wave if it clears the $0.520 resistance zone.
XRP Price Dives Over 15%
XRP price started a major decline below the $0.500 support after Ethereum and Bitcoin nosedived. There was a major decline below the $0.4850 support zone.
The price tested the $0.460 zone. A low is formed at $0.460 and the price is now consolidating losses. It is showing a lot of bearish signs below the 23.6% Fib retracement level of the downward move from the $0.5767 swing high to the $0.460 low.
The price is now trading below $0.5880 and the 100-hourly Simple Moving Average. There is also a key bearish trend line forming with resistance at $0.5180 on the hourly chart of the XRP/USD pair. If there is a recovery wave, the price could face resistance near the $0.4880 level.
The first major resistance is near the $0.500 level. The next key resistance could be $0.5180 or the trend line or the 50% Fib retracement level of the downward move from the $0.5767 swing high to the $0.460 low. A clear move above the $0.520 resistance might send the price toward the $0.5350 resistance.
The next major resistance is near the $0.5440 level. Any more gains might send the price toward the $0.550 resistance or even $0.5650 in the near term.
More Downsides?
If XRP fails to clear the $0.520 resistance zone, it could continue to move down. Initial support on the downside is near the $0.4650 level. The next major support is at $0.460.
If there is a downside break and a close below the $0.460 level, the price might continue to decline toward the $0.4350 support in the near term. The next major support sits at $0.4250.
Technical Indicators
Hourly MACD – The MACD for XRP/USD is now gaining pace in the bearish zone.
Hourly RSI (Relative Strength Index) – The RSI for XRP/USD is now below the 50 level.
Major Support Levels – $0.4600 and $0.4500.
Major Resistance Levels – $0.5000 and $0.5200.


