Reason to trust
How Our News is Made
Strict editorial policy that focuses on accuracy, relevance, and impartiality
Ad discliamer
Morbi pretium leo et nisl aliquam mollis. Quisque arcu lorem, ultricies quis pellentesque nec, ullamcorper eu odio.
Ripple is struggling to stay above the key $0.2600 support against the US Dollar. XRP price could nosedive if there is a close below $0.2600 and $0.2550.
- Ripple is showing a few bearish signs below the $0.2750 and $0.2800 resistance levels against the US dollar.
- The price is testing the $0.2600 support and it is well below the 100 simple moving average (4-hours).
- There is a key bearish trend line forming with resistance near $0.2720 on the 4-hours chart of the XRP/USD pair (data source from Kraken).
- The pair could either rally above $0.2750 or it might slide towards the $0.2150 support.
Ripple’s XRP Price is Struggling To Recover
After struggling to clear the $0.3120 resistance, ripple’s XRP price started a fresh decline. The price declined heavily below the $0.2800 support level and it even spiked below $0.2600.
A low was formed near $0.2390 before the price started an upside correction. There was a break above the $0.2500 and $0.2550 levels. The price climbed above the 23.6% Fib retracement level of the downward move from the $0.3306 swing high to $0.2390 low.
However, the price seems to be facing resistance near the $0.2850 level. There is also a key bearish trend line forming with resistance near $0.2720 on the 4-hours chart of the XRP/USD pair.
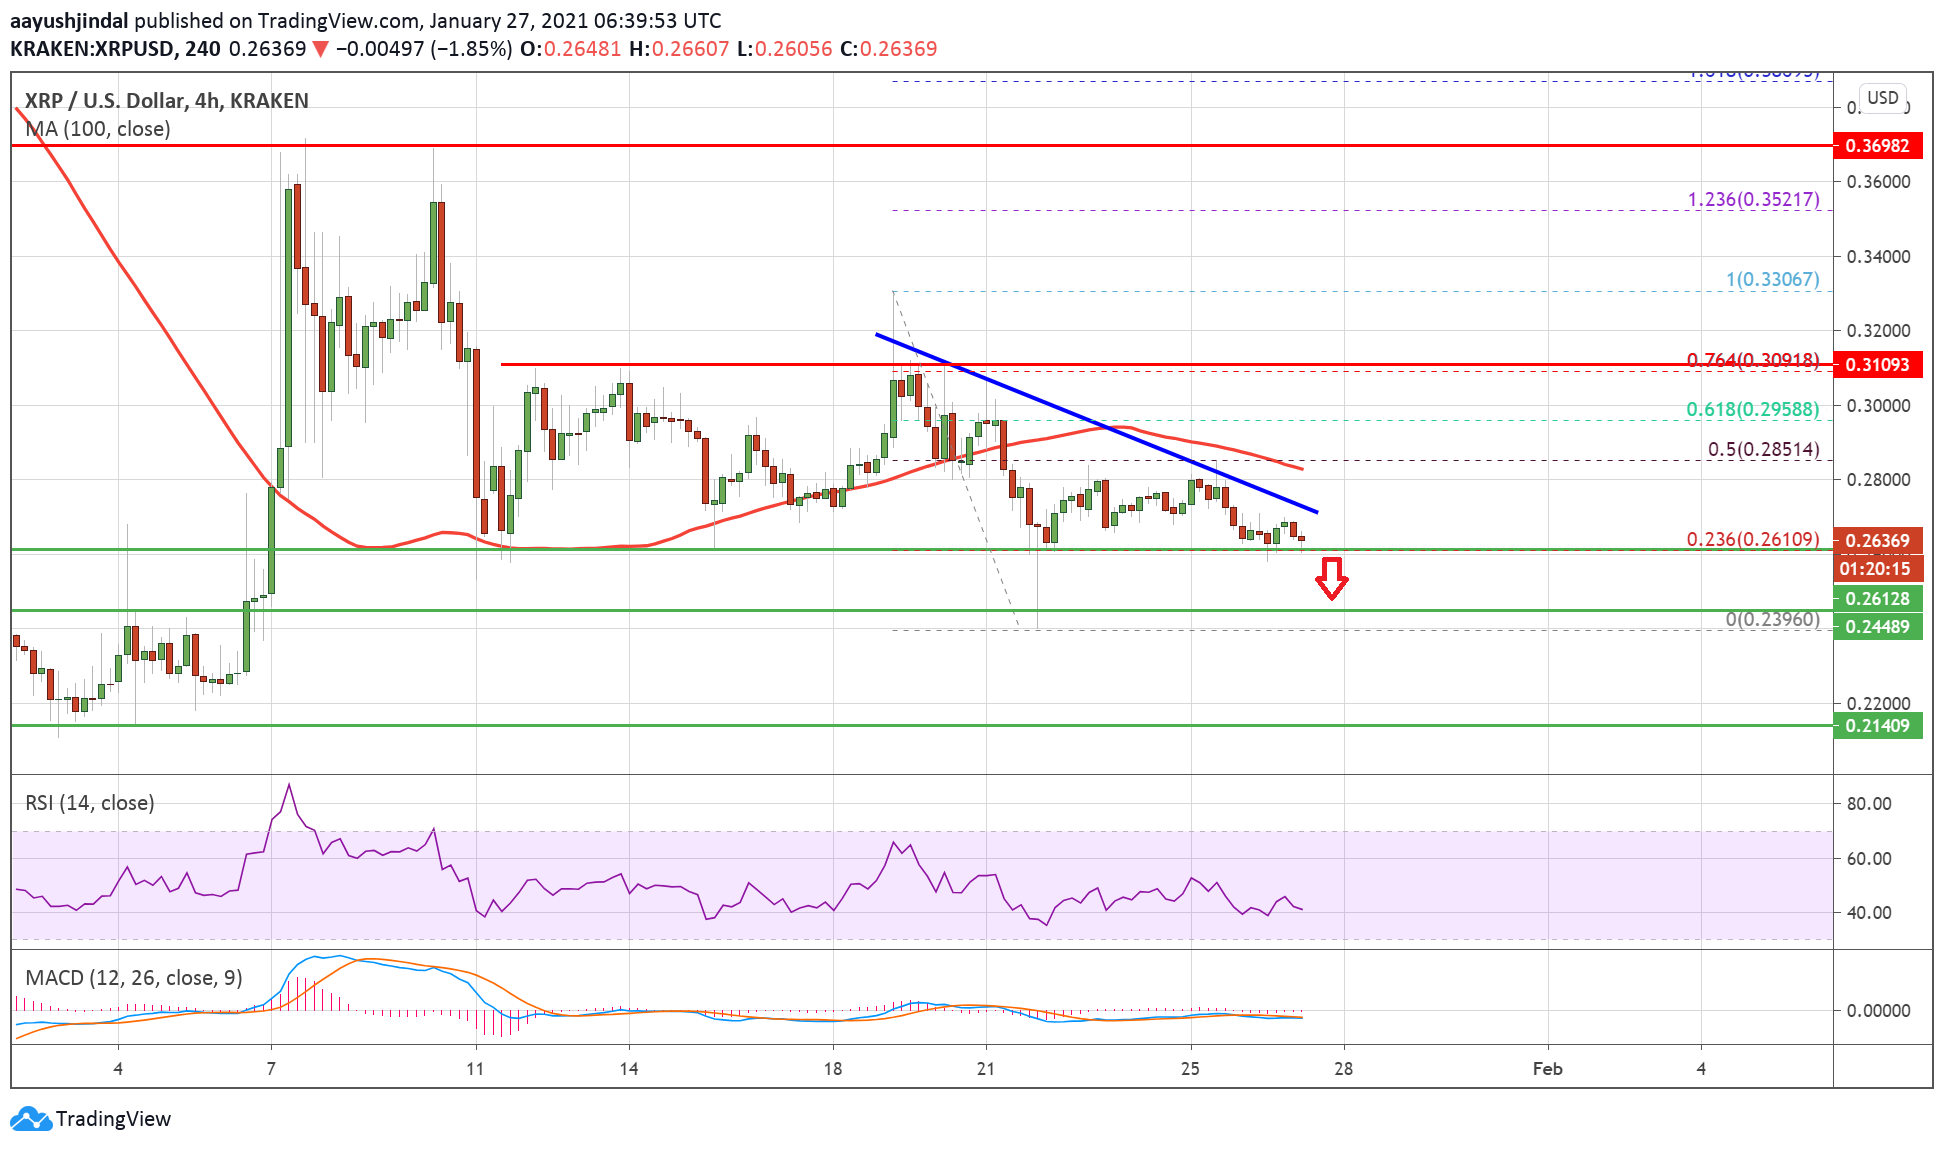
Source: XRPUSD on TradingView.com
The trend line is close to the 50% Fib retracement level of the downward move from the $0.3306 swing high to $0.2390 low. XRP is now testing the $0.2600 support and it is well below the 100 simple moving average (4-hours).
If there is a downside break below the $0.2600 support level, the bears are likely to gain strength. In the stated case, there is a risk of a sharp decline towards the $0.2400 and $0.2350 levels. The price could even revisit the $0.2150 level in the near term.
Fresh Increase in XRP?
If ripple stays above the $0.2600 support zone, there are chances of a fresh increase. Th first key resistance is near the trend line and $0.2750. The next major resistance is near the $0.2800 level and the 100 SMA (H4).
A successful close above the $0.2800 level could open the doors for a surge towards the $0.3000 and $0.3120 levels.
Technical Indicators
4-Hours MACD – The MACD for XRP/USD is showing negative signs in the bearish zone.
4-Hours RSI (Relative Strength Index) – The RSI for XRP/USD is well below the 50 level.
Major Support Levels – $0.2600, $0.2450 and $0.2150.
Major Resistance Levels – $0.2750, $0.2800 and $0.35000.