Reason to trust
How Our News is Made
Strict editorial policy that focuses on accuracy, relevance, and impartiality
Ad discliamer
Morbi pretium leo et nisl aliquam mollis. Quisque arcu lorem, ultricies quis pellentesque nec, ullamcorper eu odio.
Ripple failed to stay above the $0.2500 pivot level and started a fresh decline against the US Dollar. XRP price is likely to continue lower towards $0.2380 or $0.2350.
- Ripple started a fresh decline after it struggled to clear the $0.2590-$0.2600 zone against the US dollar.
- The price is now trading below the $0.2500 support and the 100 hourly simple moving average.
- There was a break below a major contracting triangle with support at $0.2465 on the hourly chart of the XRP/USD pair (data source from Kraken).
- The pair is likely to continue lower towards the $0.2380 support or even $0.2350.
Ripple Price is Showing Bearish Signs
After a strong upward move, ripple failed to stay above the $0.2550 resistance. XRP price topped near the $0.2590-$0.2600 resistance zone, and recently started a steady decline.
A high was formed near $0.2592 before the bears took control. There was a break below the $0.2550 and $0.2500 support levels. The price even spiked below $0.2420 and the 100 hourly simple moving average.
A low was formed near $0.2407 before there was a short-term upside correction. However, the price failed to gain strength above $0.2500 and resumed its decline. There was a break below a major contracting triangle with support at $0.2465 on the hourly chart of the XRP/USD pair.
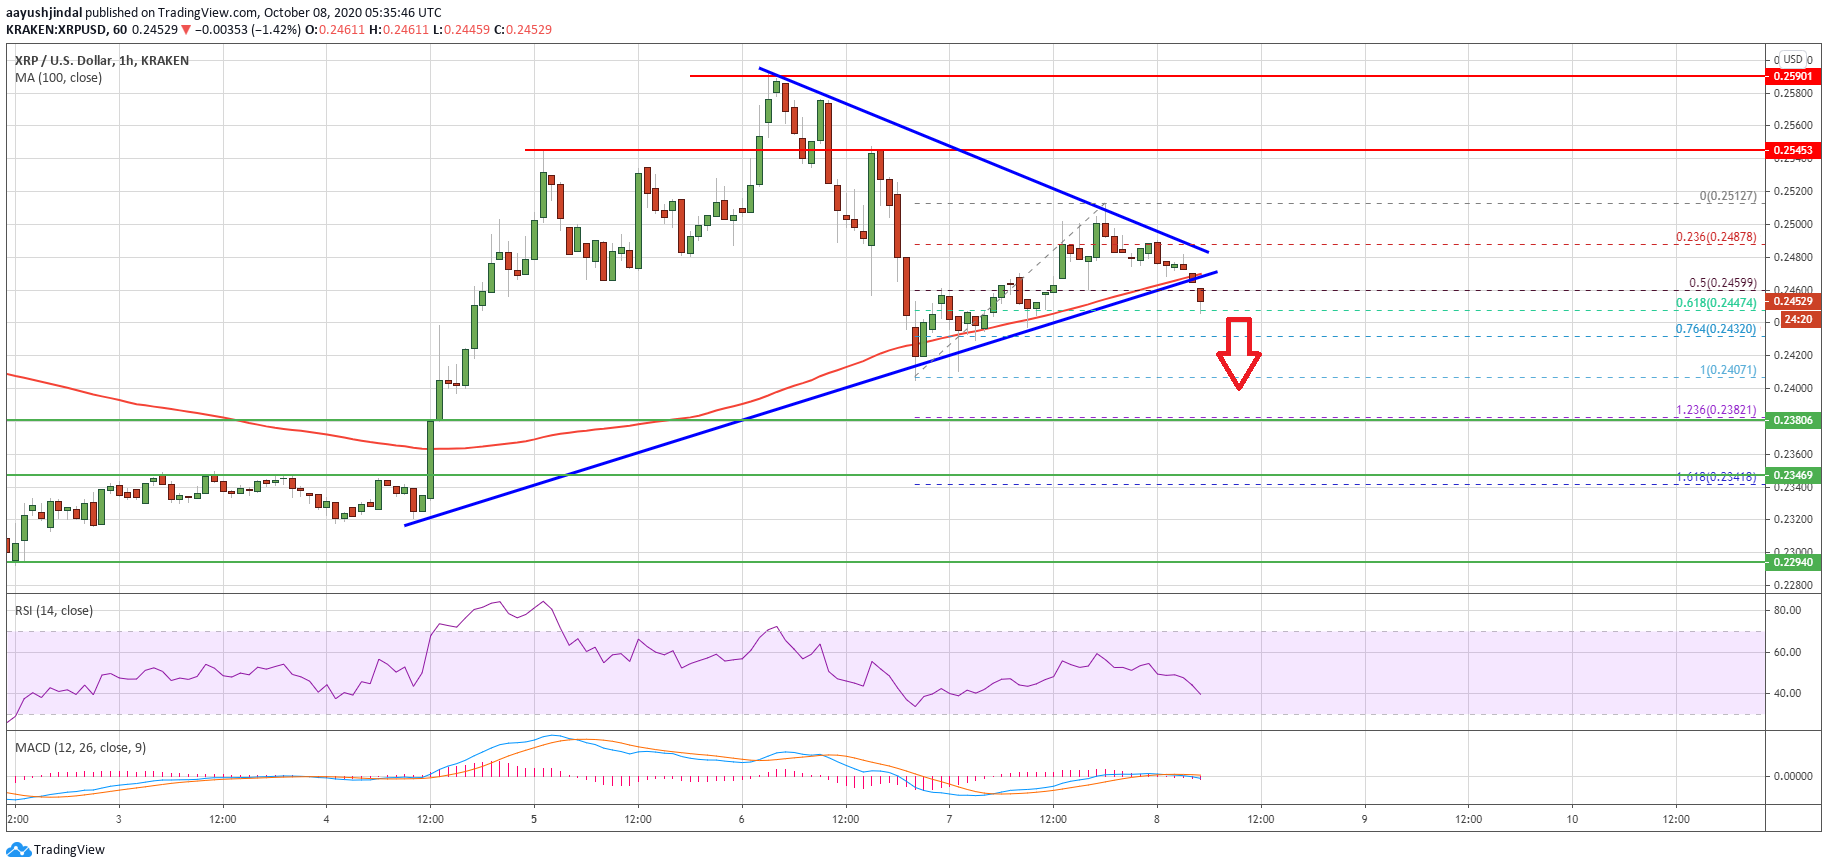
Ripple price dives above $0.2500. Source: TradingView.com
The price is now testing the 61.8% Fib retracement level of the recent upside correction from the $0.2407 low to $0.2512 high. It seems like the bears are aiming more downsides below the $0.2420 support.
The next key support is near the $0.2380 level. It is close to the 1.236 Fib extension level of the recent upside correction from the $0.2407 low to $0.2512 high. Any further losses could lead ripple towards the $0.2350 support.
Fresh Increase in XRP?
An initial resistance for ripple is near the $0.2645 level and the 100 hourly simple moving average. The first major resistance is near the $0.2500 level.
A successful break above the 100 hourly SMA and then a follow up move above the $0.2500 resistance might open the doors for a fresh increase in the near term. The next major resistance is near the $0.2550 level.
Technical Indicators
Hourly MACD – The MACD for XRP/USD is slowly gaining pace in the bearish zone.
Hourly RSI (Relative Strength Index) – The RSI for XRP/USD is currently declining towards the 35 level.
Major Support Levels – $0.2420, $0.2380 and $0.2350.
Major Resistance Levels – $0.2465, $0.2500 and $0.2550.