Reason to trust
How Our News is Made
Strict editorial policy that focuses on accuracy, relevance, and impartiality
Ad discliamer
Morbi pretium leo et nisl aliquam mollis. Quisque arcu lorem, ultricies quis pellentesque nec, ullamcorper eu odio.
Ripple started a downside correction below $0.6500 against the US Dollar. XRP price is likely preparing for the next major move, similar to bitcoin and ETH.
- Ripple corrected lower, but it remained stable above $0.6000 against the US dollar.
- The price is struggling to clear $0.6500, but it is well above the 100 simple moving average (4-hours).
- There is a major contracting triangle forming with resistance at $0.6340 on the 4-hours chart of the XRP/USD pair (data source from Kraken).
- The pair is likely to surge above $0.6500 and $0.6800 as long as it is above the $0.5500 support.
Ripple’s XRP Price is Holding Key Supports
After trading as low as $0.4566, ripple’s XRP price started a fresh increase above $0.5500. Bitcoin price climbed back above $19,000 and ETH broke the $600 resistance.
XRP is now struggling to clear the $0.6350 and $0.6500 resistance levels. The last swing high was formed near $0.6896 before the price declined below $0.6000. It tested the 50% Fib retracement level of the upward move from the $0.4566 low to $0.6896 high.
The price remained well bid above $0.5750 and it recovered higher. It is now trading well above the $0.6000 support and the 100 simple moving average (4-hours).
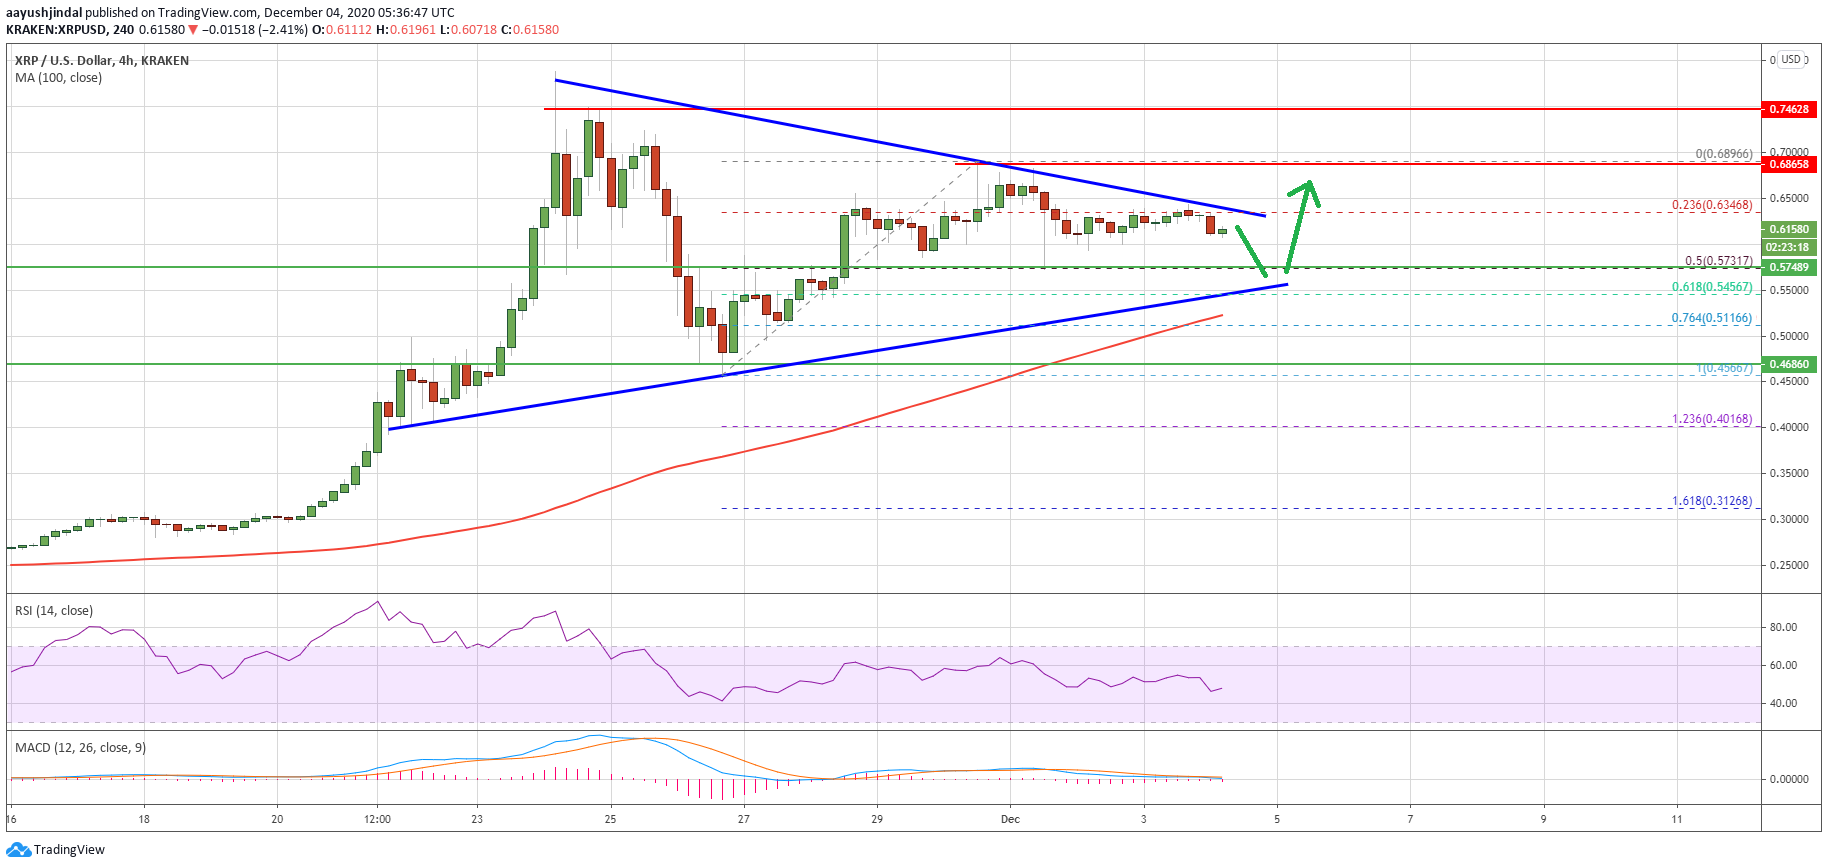
Source: XRPUSD on TradingView.com
More importantly, there is a major contracting triangle forming with resistance at $0.6340 on the 4-hours chart of the XRP/USD pair. The triangle support is close to the 61.8% Fib retracement level of the upward move from the $0.4566 low to $0.6896 high.
If there is an upside break above the triangle resistance, the price could attempt to clear the $0.6500 resistance level. A successful close above the $0.6500 resistance could lift the price towards the $0.7000 resistance level in the next 3-4 days.
Downsides Break in XRP?
If ripple fails to surpass the $0.6340 and $0.6500 resistance levels, it could slowly move down. An initial support on the downside is near the $0.6000 level.
The first major support is now forming near the $0.5750 level. The main support is near the $0.5500 level, below which the price may even struggle to stay above the 100 simple moving average (4-hours).
Technical Indicators
4-Hours MACD – The MACD for XRP/USD is losing pace in the bearish zone.
4-Hours RSI (Relative Strength Index) – The RSI for XRP/USD is currently just below the 50 level.
Major Support Levels – $0.6000, $0.5750 and $0.5500.
Major Resistance Levels – $0.6340, $0.6500 and $0.7000.