
Reason to trust
How Our News is Made
Strict editorial policy that focuses on accuracy, relevance, and impartiality
Ad discliamer
Morbi pretium leo et nisl aliquam mollis. Quisque arcu lorem, ultricies quis pellentesque nec, ullamcorper eu odio.
Tron price is holding gains above the $0.1550 zone against the US Dollar. TRX is outperforming Bitcoin and could start a fresh increase above $0.1620.
- Tron is stable and holding gains above $0.1550 against the US dollar.
- The price is trading below $0.1620 and the 100-hourly simple moving average.
- There is a key rising channel forming with support at $0.1595 on the hourly chart of the TRX/USD pair (data source from Kraken).
- The pair could continue to climb higher toward $0.1620 or even $0.1650.
Tron Price Eyes Fresh Increase
Recently, Bitcoin and Ethereum saw a fresh decline below $60,000 and $2,650 respectively. However, Tron price remained stable above the $0.1550 support.
A low was formed near $0.1554 and the price started a decent upward move. There was a move above the $0.1585 resistance level. The price climbed above the 23.6% Fib retracement level of the downward move from the $0.1688 swing high to the $0.1554 low.
However, the bears seem to be active near the $0.1620 level. TRX price is now trading below $0.1620 and the 100-hourly simple moving average. There is also a key rising channel forming with support at $0.1595 on the hourly chart of the TRX/USD pair.
On the upside, an initial resistance is near the $0.1610 level. The first major resistance is near $0.1620, above which the price could accelerate higher. The next resistance is near $0.1650 or the 76.4% Fib retracement level of the downward move from the $0.1688 swing high to the $0.1554 low.
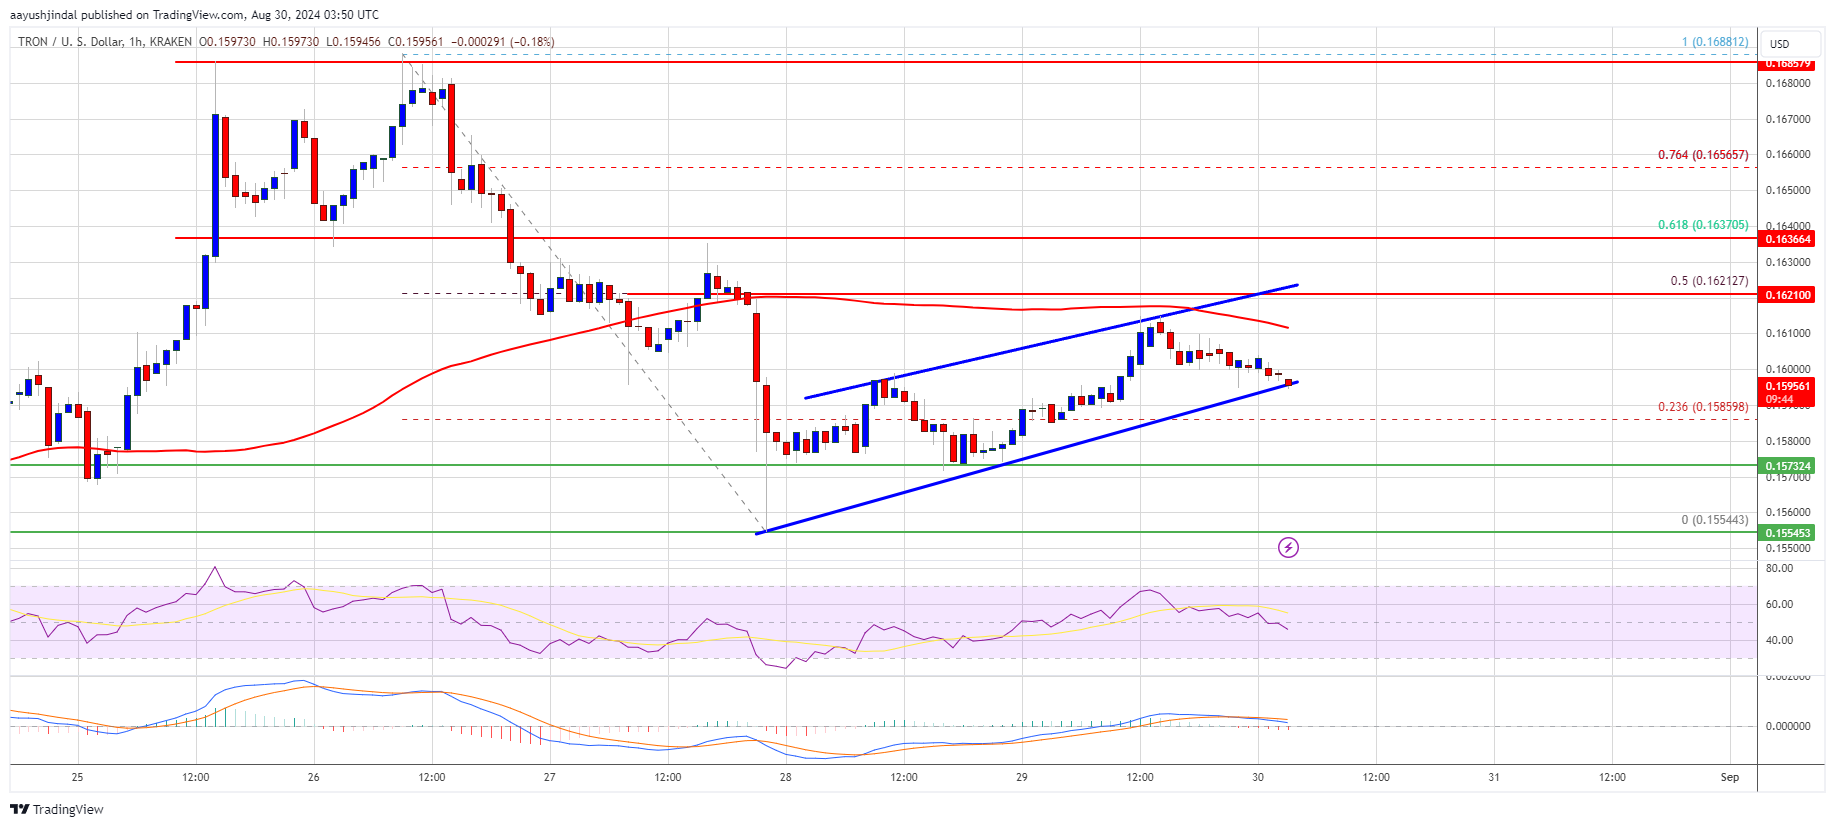
A close above the $0.1650 resistance might send TRX further higher toward $0.1720. The next major resistance is near the $0.1740 level, above which the bulls are likely to aim for a larger increase toward $0.1850 in the near term.
Are Dips Supported in TRX?
If TRX price fails to clear the $0.1620 resistance, it could start a downside correction. Initial support on the downside is near the $0.1595 zone and the channel’s trend line.
The first major support is near the $0.1575, below which it could test $0.1550. Any more losses might send Tron toward the $0.1520 support in the coming sessions.
Technical Indicators
Hourly MACD – The MACD for TRX/USD is gaining momentum in the bullish zone.
Hourly RSI (Relative Strength Index) – The RSI for TRX/USD is currently above the 50 level.
Major Support Levels – $0.1550 and $0.1520.
Major Resistance Levels – $0.1620 and $0.1650.


