Reason to trust
How Our News is Made
Strict editorial policy that focuses on accuracy, relevance, and impartiality
Ad discliamer
Morbi pretium leo et nisl aliquam mollis. Quisque arcu lorem, ultricies quis pellentesque nec, ullamcorper eu odio.
Solana started a decent upward move from the $110 zone. SOL price is rising and might increase further above the $155 resistance zone.
- SOL price started a recovery wave above the $135 and $140 levels against the US Dollar.
- The price is now trading above $145 and the 100-hourly simple moving average.
- There was a break above a key bearish trend line with resistance at $136 on the hourly chart of the SOL/USD pair (data source from Kraken).
- The pair could start another increase if it clears the $155 resistance zone.
Solana Price Recovers 15%
Solana price declined heavily below the $165 and $150 levels like Bitcoin and Ethereum. It even traded below the $120 support before the bulls appeared. A low was formed at $109 and SOL recently started a recovery wave.
There was a move above the $120 and $135 resistance levels. The price climbed above the 50% Fib retracement level of the downward move from the $184 swing high to the $109 low. Besides, there was a break above a key bearish trend line with resistance at $136 on the hourly chart of the SOL/USD pair.
Solana is now trading above $145 and the 100-hourly simple moving average. On the upside, the price is facing resistance near the $155 level. It is close to the 61.8% Fib retracement level of the downward move from the $184 swing high to the $109 low.
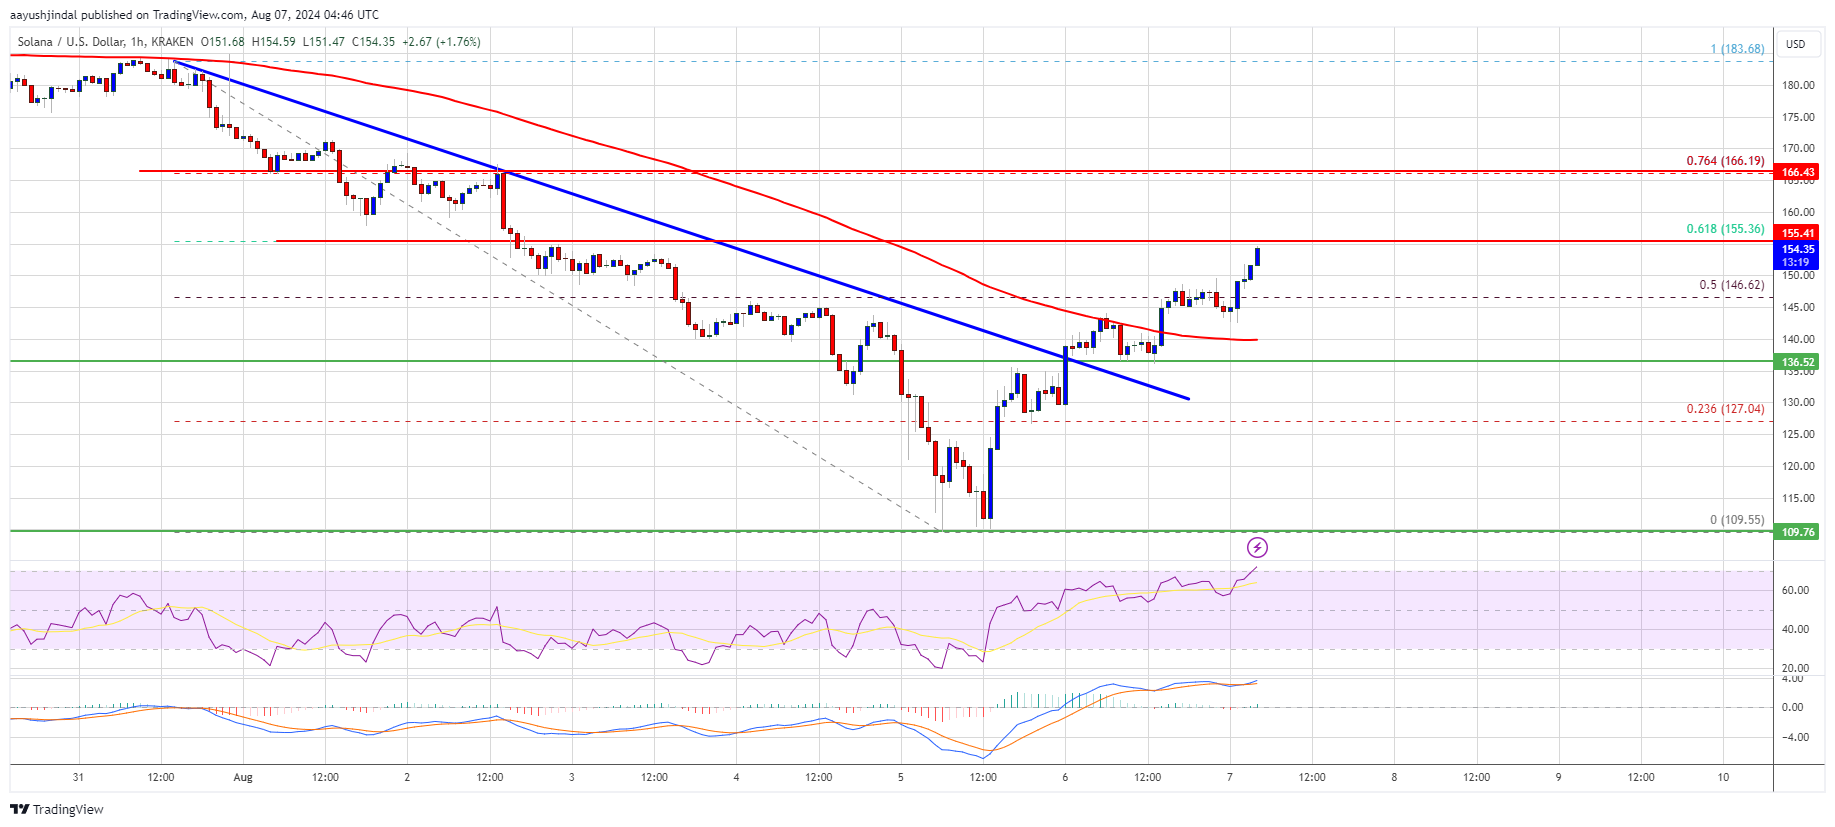
The next major resistance is near the $166 level. A successful close above the $166 resistance could set the pace for another steady increase. The next key resistance is near $184. Any more gains might send the price toward the $195 level.
Another Decline in SOL?
If SOL fails to rise above the $155 resistance, it could start another decline. Initial support on the downside is near the $140 level. The first major support is near the $135 level.
A break below the $135 level might send the price toward $122. If there is a close below the $122 support, the price could decline toward the $110 support in the near term.
Technical Indicators
Hourly MACD – The MACD for SOL/USD is gaining pace in the bullish zone.
Hourly Hours RSI (Relative Strength Index) – The RSI for SOL/USD is above the 50 level.
Major Support Levels – $140 and $135.
Major Resistance Levels – $155 and $166.