
Reason to trust
How Our News is Made
Strict editorial policy that focuses on accuracy, relevance, and impartiality
Ad discliamer
Morbi pretium leo et nisl aliquam mollis. Quisque arcu lorem, ultricies quis pellentesque nec, ullamcorper eu odio.
Litecoin price is gaining momentum above $65.00 against the US Dollar. LTC is likely to continue higher towards the $70.00 and $72.00 resistance levels in the near term.
- Litecoin remained well bid and surpassed the $65.00 resistance zone against the US Dollar.
- The price is now trading nicely above the $66.00 level and the 100 simple moving average (4-hours).
- There is a major bullish trend line forming with support near $63.00 on the 4-hours chart of the LTC/USD pair (data feed from Kraken).
- The price is likely to continue higher above the $68.00 and $70.00 resistance levels.
Litecoin Price is Surging
In the last technical analysis, we discussed why litecoin could surge above $65.00 against the US Dollar. LTC price did gain momentum and broke many hurdles near $64.00 and $65.00.
The recent upward move was such that the price broke the 76.4% Fib retracement level of the downward move from the $66.60 swing high to $61.07 swing low. Recently, bitcoin and ETH corrected lower, but litecoin remained well bid above the $65.00 level.
The price is now trading nicely above the $66.00 level and the 100 simple moving average (4-hours). There is also a major bullish trend line forming with support near $63.00 on the 4-hours chart of the LTC/USD pair.
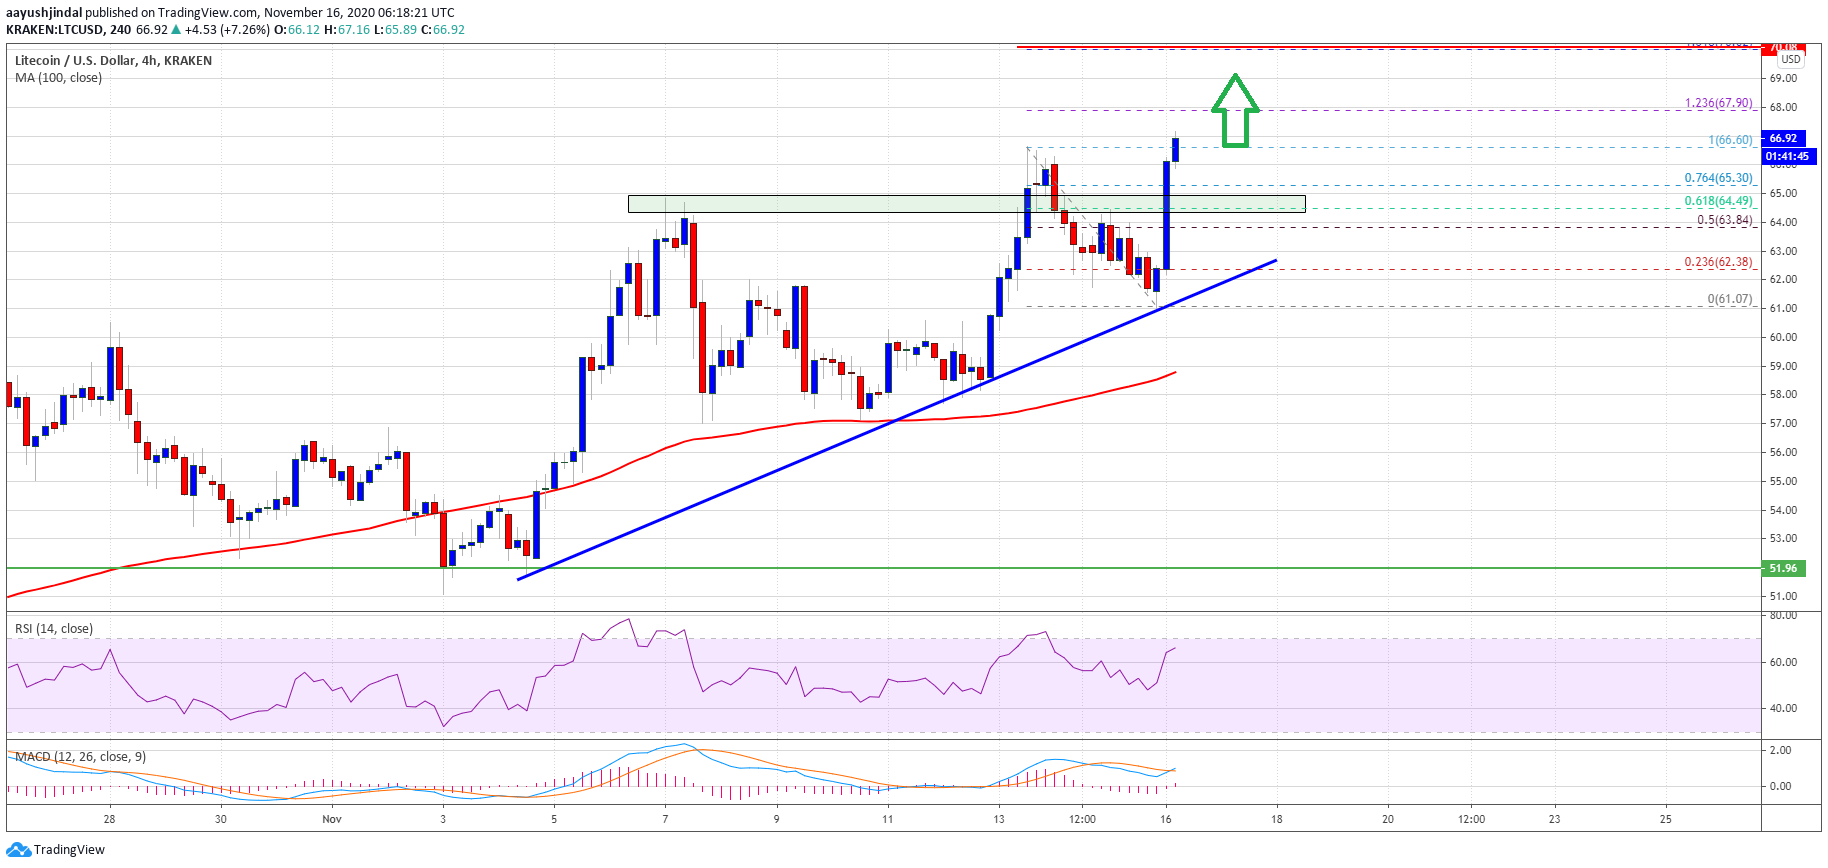
An initial resistance is near the $67.90 and $68.0 levels. The first major resistance is near the $70.00 level. The stated $70.00 hurdle is also close to the 1.618 Fib extension level of the downward move from the $66.60 swing high to $61.07 swing low. Any further gains could lead the price towards the $72.00 resistance level in the near term.
Dips Limited in LTC?
If litecoin starts a downside correction, it might find a strong buying interest near $65.00. The next major support for the bulls is near the $63.00 level and the highlighted bullish trend line on the hourly chart.
Any further losses may perhaps send the price towards the $60.00 support or the 100 simple moving average (4-hours) in the near term. Below $60.00, the price is likely to move into a bearish zone.
Technical indicators:
4-hours MACD – The MACD is now gaining momentum in the bullish zone.
4-hours RSI (Relative Strength Index) – The RSI for LTC/USD is currently rising and it is well above the 55 level.
Major Support Levels – $65.00 followed by $63.00.
Major Resistance Levels – $70.00 and $72.00.


