
Reason to trust
How Our News is Made
Strict editorial policy that focuses on accuracy, relevance, and impartiality
Ad discliamer
Morbi pretium leo et nisl aliquam mollis. Quisque arcu lorem, ultricies quis pellentesque nec, ullamcorper eu odio.
Litecoin price is gaining momentum above $60.00 against the US Dollar. LTC is likely to continue higher (similar to bitcoin) towards $70.00 or $75.00 in the near term.
- Litecoin started a strong rally above the $55.50 and $58.00 resistance levels against the US Dollar.
- The price is now trading nicely above the $60.00 level and the 100 simple moving average (4-hours).
- There was a break above a major bearish trend line with resistance near $54.00 on the 4-hours chart of the LTC/USD pair (data feed from Kraken).
- The bulls seem to be aiming a larger rally towards the $70.00 resistance zone.
Litecoin Price is Gaining Bullish Momentum
This week, bitcoin price started a strong rally above $14,000 and $15,000, but altcoins lacked momentum. However, they started picking up momentum, and recently, there was a decent increase in Ethereum, ripple and litecoin against the US Dollar.
A strong support base was formed near $52.00 before litecoin price started a strong rally. There was a break above a major bearish trend line with resistance near $54.00 on the 4-hours chart of the LTC/USD pair.
The pair gained pace above the $55.00 resistance and 100 simple moving average (4-hours). It opened the doors for more gains above the $60.00 resistance and the price even climbed above the $60.46 swing high. An initial resistance is near the $62.65 level.
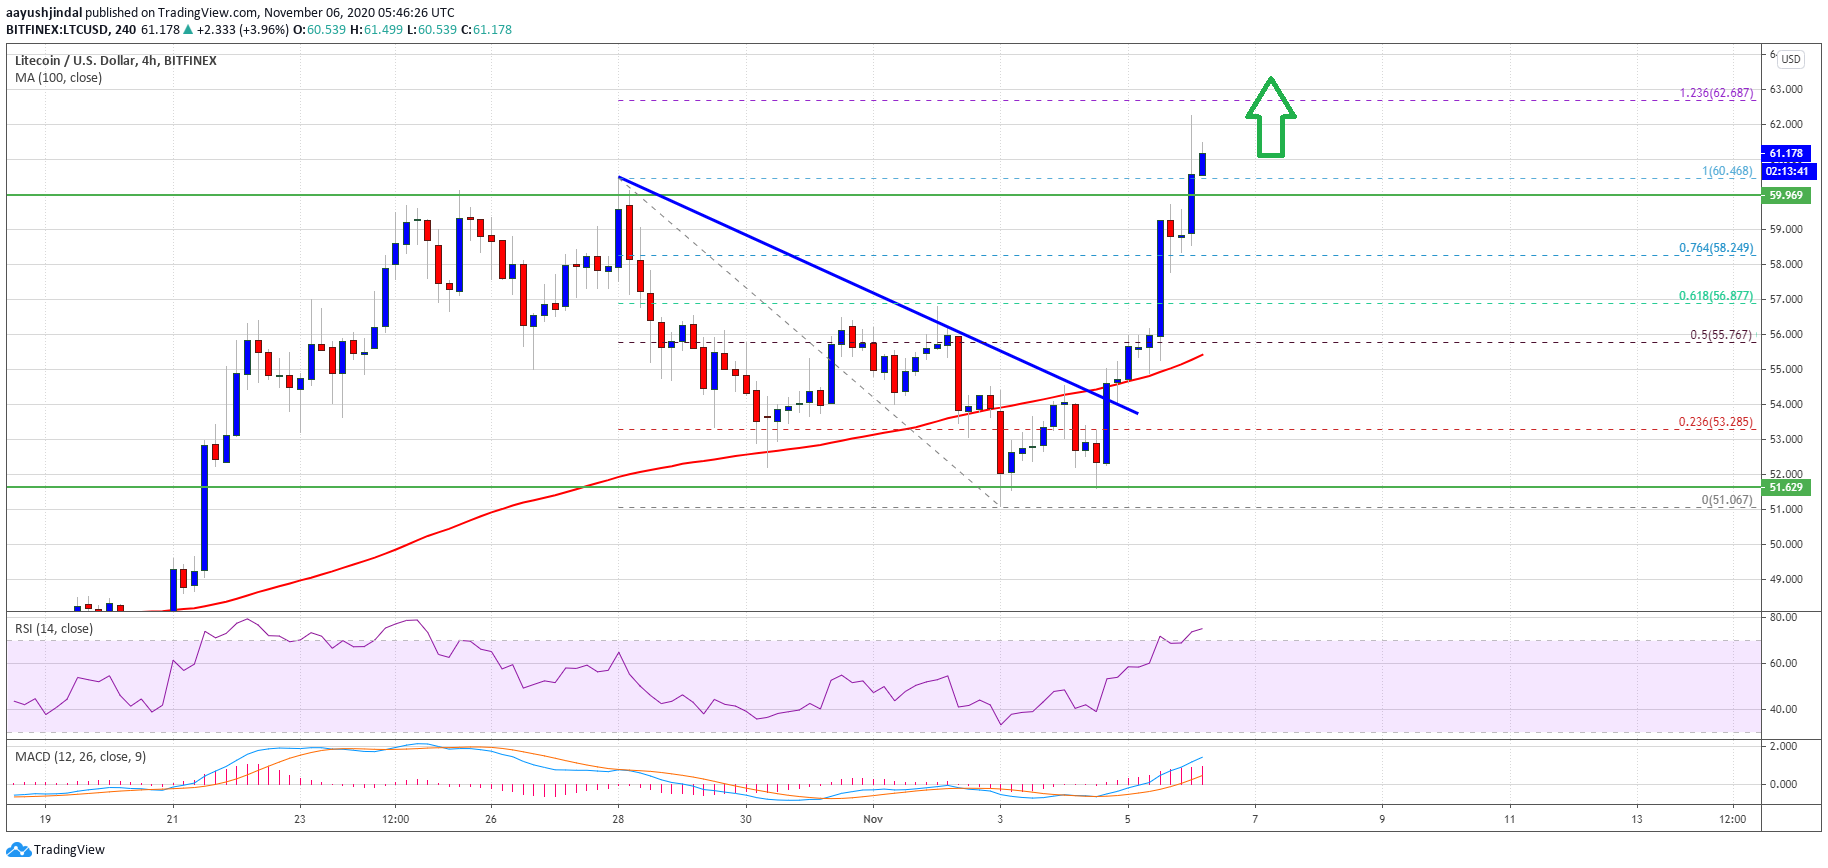
Source: LTCUSD on TradingView.com
The 1.236 Fib extension level of the downward move from the $60.46 high to $51.06 swing low is also near the $62.68 level. If there are more upsides, the price is likely to continue higher towards the $70.00 resistance.
An intermediate resistance could be near $66.50 or the 1.618 Fib extension level of the downward move from the $60.46 high to $51.06 swing low.
Dips Likely Limited in LTC
If litecoin fails to continue above the $62.65 resistance or the $65.00 zone, there are chances of a downside correction. On the downside, the first major support is near the $60.00 level.
The main support is now forming near the $58.00 level, below which there is a risk of a drop towards the $55.00 support and the 100 simple moving average (4-hours).
Technical indicators:
4-hours MACD – The MACD is now gaining pace in the bullish zone.
4-hours RSI (Relative Strength Index) – The RSI for LTC/USD is currently rising and it is well above the 70 level.
Major Support Levels – $60.00 followed by $58.00.
Major Resistance Levels – $62.65 and $66.50.


