
Reason to trust
How Our News is Made
Strict editorial policy that focuses on accuracy, relevance, and impartiality
Ad discliamer
Morbi pretium leo et nisl aliquam mollis. Quisque arcu lorem, ultricies quis pellentesque nec, ullamcorper eu odio.
Chainlink (LINK) seems to be forming a short-term top near $12.98. A head and shoulders pattern is likely forming, which could trigger a sharp decline below the $11.50 support.
- Chainlink token price started a fresh decline after it failed to clear the $13.00 resistance against the US dollar.
- The price is holding the $11.50 support level and the 100 simple moving average (4-hours).
- There is a crucial contracting triangle forming with resistance near $12.00 on the 4-hours chart of the LINK/USD pair (data source from Kraken).
- A head and shoulders pattern seems to be forming with support near $11.40-$11.50.
Chainlink (LINK) Price Remains At Risk
This past week, we saw a sharp increase in chainlink (LINK) above the $11.50 and $12.00 resistance levels. The price even broke the $12.50 resistance and settled well above the 100 simple moving average (4-hours).
A new monthly high was formed near $12.98 and the price recently started a downside correction. There was a break below the $12.00 support level. The bears were able to push the price below the 23.6% Fib retracement level of the upward move from the $9.79 swing low to $12.98 high.
LINK price found support near the $11.40 zone and it remained well bid above the 100 simple moving average (4-hours). The 50% Fib retracement level of the upward move from the $9.79 swing low to $12.98 high also acted as a support.
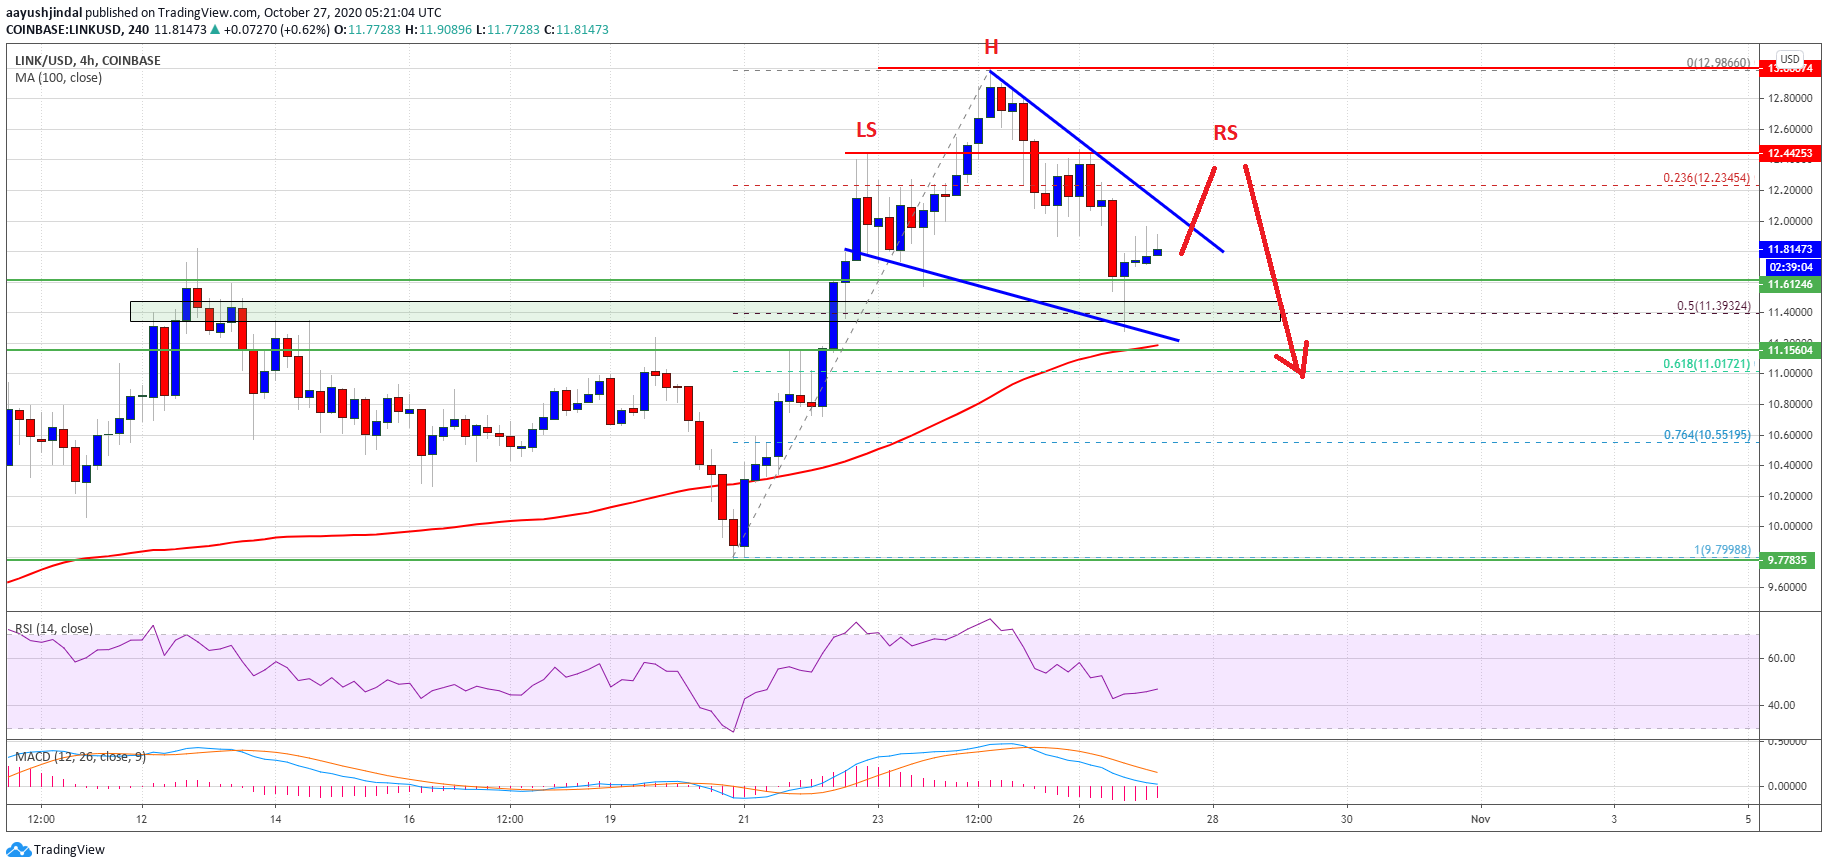
Source: LINKUSD on TradingView.com
It is currently consolidating losses (similar to Ethereum and ripple), but facing a couple of key hurdles. It seems like is a crucial contracting triangle forming with resistance near $12.00 on the 4-hours chart of the LINK/USD pair.
More importantly, there is a potential head and shoulders pattern forming with support near $11.40-$11.50. If the price climbs towards the $12.40 resistance and fails to continue higher, there is a risk of a sharp decline. In the stated case, the price could decline heavily below the $11.40 support and the 100 SMA.
Fresh Increase?
If chainlink’s price breaks the triangle resistance and accelerates above the $12.40 resistance, it could invalidate the mentioned bearish scenario.
The next major resistance on the upside is still near the $13.00 zone. A successful close above the $13.00 level might open the doors for a push towards the $15.00 resistance in the coming days.
Technical Indicators
4-hours MACD – The MACD for LINK/USD is losing pace in the bearish zone.
4-hours RSI (Relative Strength Index) – The RSI for LINK/USD is now well below the 50 level.
Major Support Levels – $11.60, $11.50 and $11.40.
Major Resistance Levels – $12.00, $12.40 and $13.00.


