
Reason to trust
How Our News is Made
Strict editorial policy that focuses on accuracy, relevance, and impartiality
Ad discliamer
Morbi pretium leo et nisl aliquam mollis. Quisque arcu lorem, ultricies quis pellentesque nec, ullamcorper eu odio.
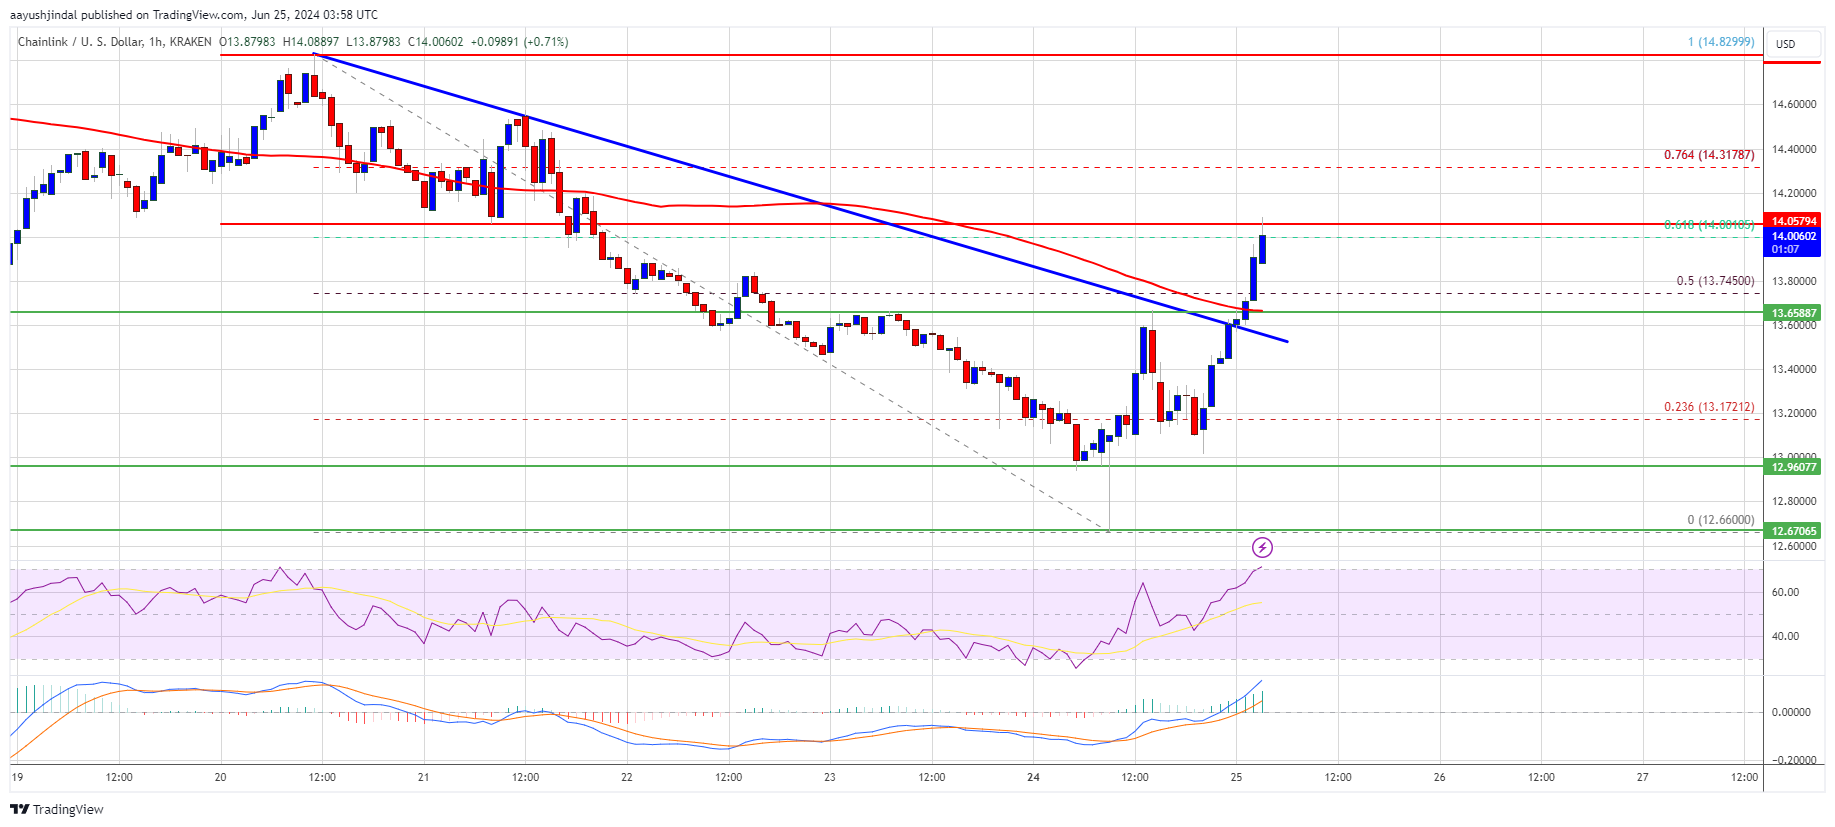
Chainlink’s LINK price is recovering from the $12.65 support. The price is gaining bullish momentum and might aim for a move above the $14.20 resistance.
- Chainlink price is showing bullish signs and eyeing more gains above $14.00 against the US dollar.
- The price is trading above the $13.50 level and the 100-hourly simple moving average.
- There was a break above a major bearish trend line with resistance near $13.60 on the hourly chart of the LINK/USD pair (data source from Kraken).
- The price could extend gains if it clears the $14.20 resistance zone.
Chainlink Price Turns Green
In the past few sessions, Chainlink saw a decent upward move from the $12.65 zone. There was a move above the $13.00 and $13.20 levels. LINK bulls are now attempting a steady upward move like Ethereum.
There was a clear move above the 50% Fib retracement level of the downward move from the $14.82 swing high to the $12.66 low. There was also a break above a major bearish trend line with resistance near $13.60 on the hourly chart of the LINK/USD pair.
Chainlink is now trading above the $13.50 level and the 100-hourly simple moving average. Immediate resistance is near the $14.05 level or the 61.8% Fib retracement level of the downward move from the $14.82 swing high to the $12.66 low.
The next major resistance is near the $14.20 zone. A clear break above $14.20 may possibly start a steady increase toward the $14.50 level. The next major resistance is near the $14.80 level, above which the price could test $15.00. Any more gains might send the price toward the $15.50 resistance level in the coming sessions.
Are Dips Limited In LINK?
If Chainlink’s price fails to climb above the $14.20 resistance level, there could be a downside correction. Initial support on the downside is near the $13.80 level.
The next major support is near the $13.65 level or the 100-hourly simple moving average, below which the price might test the $13.50 level. Any more losses could lead LINK toward the $12.90 level in the near term.
Technical Indicators
Hourly MACD – The MACD for LINK/USD is gaining momentum in the bullish zone.
Hourly RSI (Relative Strength Index) – The RSI for LINK/USD is now above the 50 level.
Major Support Levels – $13.80 and $13.50.
Major Resistance Levels – $14.20 and $14.50.


