
Reason to trust
How Our News is Made
Strict editorial policy that focuses on accuracy, relevance, and impartiality
Ad discliamer
Morbi pretium leo et nisl aliquam mollis. Quisque arcu lorem, ultricies quis pellentesque nec, ullamcorper eu odio.
Ethereum dived towards the $1,700 level before it started a strong recovery against the US Dollar. ETH price is back above $2,000, but it is likely to face hurdles near $2,060.
- Ethereum extended its decline below $1,800 before it started a steady recovery.
- The price is still trading below $2,100 and the 100 hourly simple moving average.
- There is a major bearish trend line forming with resistance near $2,140 on the hourly chart of ETH/USD (data feed via Kraken).
- The pair is likely to face a strong resistance near the $2,060 and $2,100 levels in the near term.
Ethereum Price Recovers Losses
Ethereum extended its decline below the $1,850 support, like bitcoin. ETH even traded below the $1,800 and $1,750 support levels to move further into a bearish zone.
The price tested the $1,700 level before it started a decent recovery wave. Ether climbed higher nicely above the $1,880 and $1,950 resistance levels. The bulls pushed the price above the 50% Fib retracement level of the of the recent decline from the $2,280 swing high to $1,703 low.
Moreover, there was a break above a short-term bearish trend line with resistance near $1,940 on the hourly chart of ETH/USD. The pair is still trading below $2,100 and the 100 hourly simple moving average.
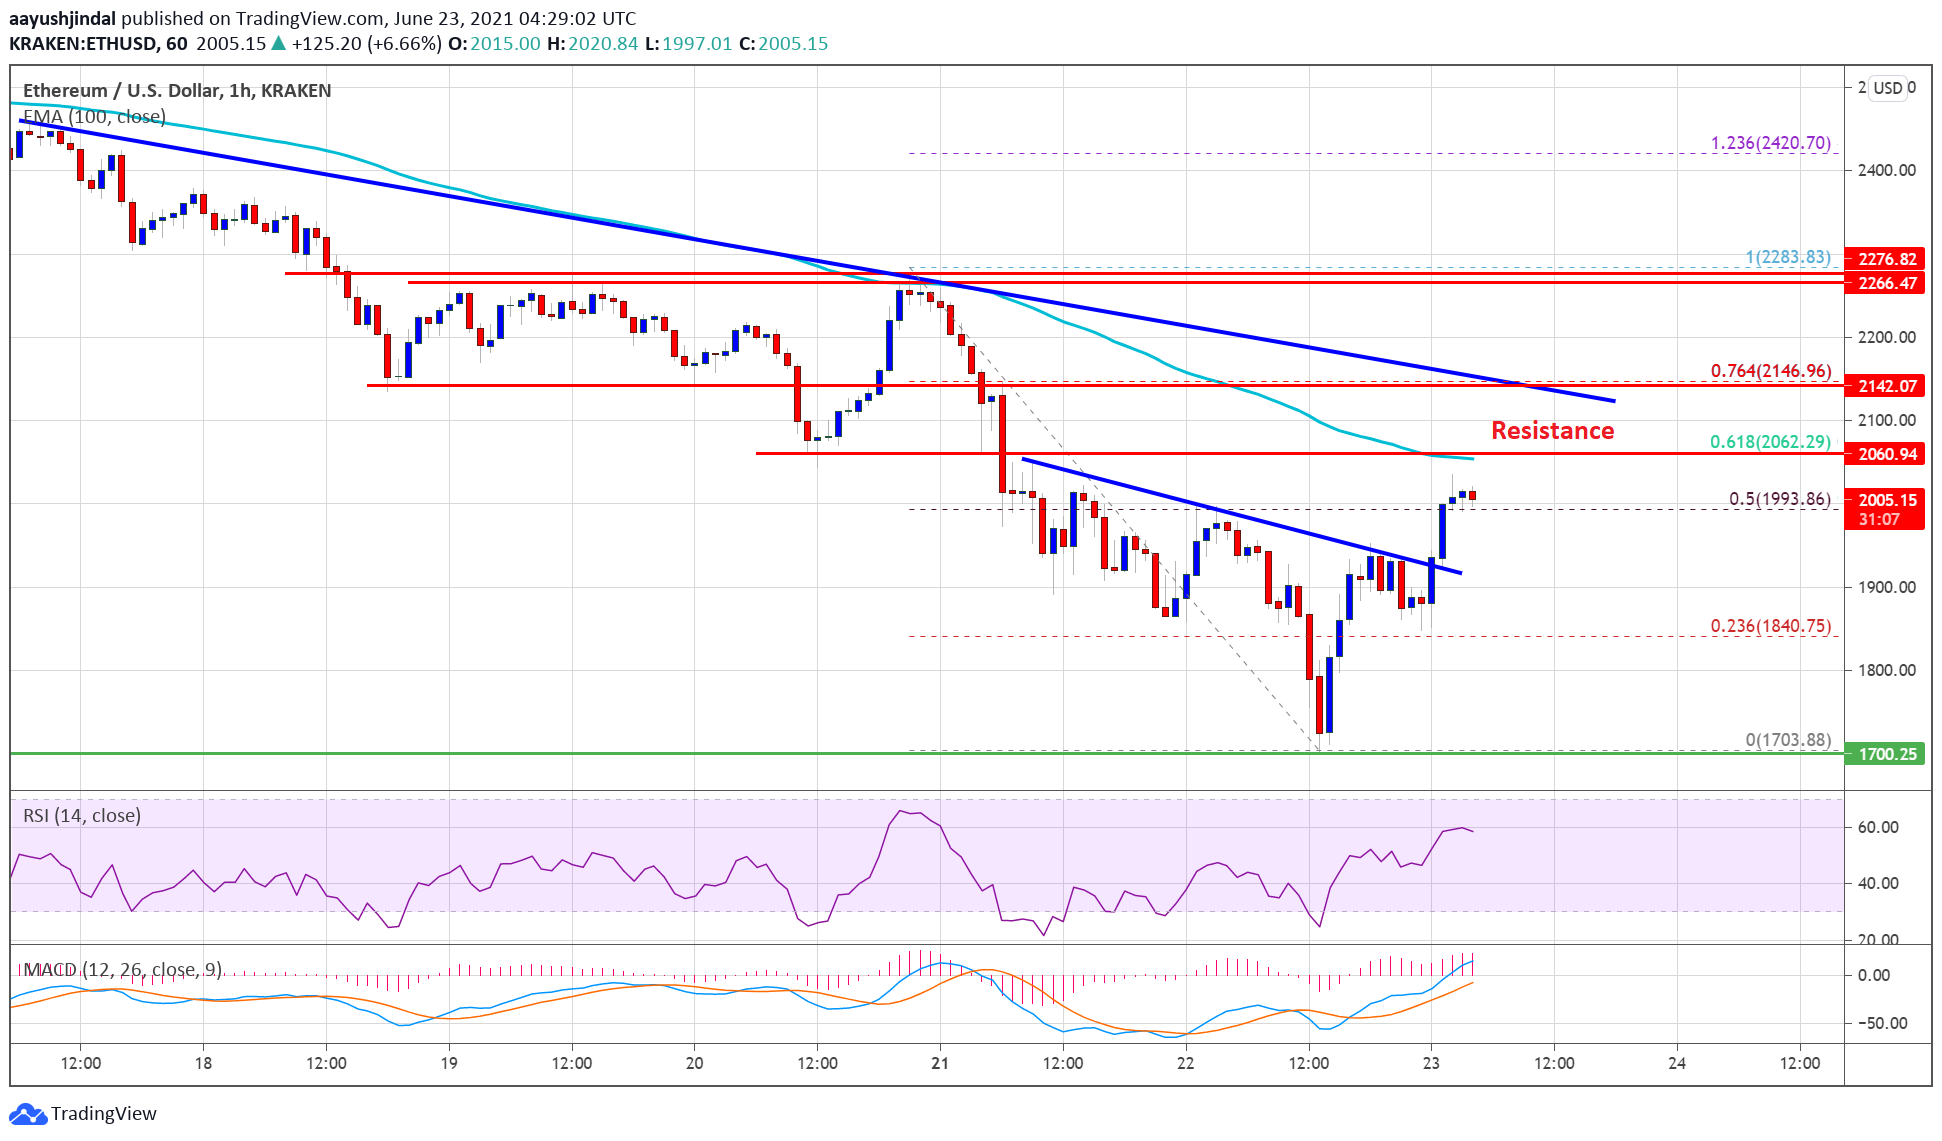
Source: ETHUSD on TradingView.com
The 61.8% Fib retracement level of the of the recent decline from the $2,280 swing high to $1,703 low is also near the $2,060 zone. The main resistance is now forming near the $2,150 level. There is also another major bearish trend line forming with resistance near $2,140 on the same chart. To move into a positive zone, ether price must clear the $2,060 and $2,150 levels in the near term.
Fresh Drop in ETH?
If Ethereum fails to clear the $2,060 and $2,150 resistance levels, it could start a fresh decline. An initial support on the downside is near the $1,940 level.
The first major support is now forming near the $1,900 level and the broken trend line. The main breakdown support is now forming near the $1,840 level. A downside break below the $1,840 could start a fresh slide towards the $1,700 zone in the coming sessions.
Technical Indicators
Hourly MACD – The MACD for ETH/USD is now moving in the bullish zone.
Hourly RSI – The RSI for ETH/USD is currently rising towards the 60 level.
Major Support Level – $1,940
Major Resistance Level – $2,060


