
Reason to trust
How Our News is Made
Strict editorial policy that focuses on accuracy, relevance, and impartiality
Ad discliamer
Morbi pretium leo et nisl aliquam mollis. Quisque arcu lorem, ultricies quis pellentesque nec, ullamcorper eu odio.
Ethereum started a strong increase above the $1,600 level against the US Dollar. ETH is up over 15% and might even clear the $1,700 resistance zone.
- Ethereum started a major increase above the $1,550 and $1,600 levels.
- The price is now trading above $1,600 and the 100 hourly simple moving average.
- There was a break above a key bearish trend line with resistance near $1,450 on the hourly chart of ETH/USD (data feed via Kraken).
- The pair could continue to rise if there is a clear move above the $1,675 level.
Ethereum Price Jumps Above $1,600
Ethereum formed a base above the $1,400 level and started a major increase. ETH was able to clear a few key hurdles near the $1,500 and $1,550 levels.
The price jumped over 15% and even surpassed the $1,600 level. There was a break above a key bearish trend line with resistance near $1,450 on the hourly chart of ETH/USD. The pair climbed sharply and surpassed the 76.4% Fib retracement level of the downward move from the $1,663 swing high to $1,357 low.
It even broke the $1,650 level and now trading near the $1,660 zone. Ether price is now trading above $1,600 and the 100 hourly simple moving average. An immediate resistance on the upside is near the $1,675 level. The first major resistance is near the $1,700 zone.
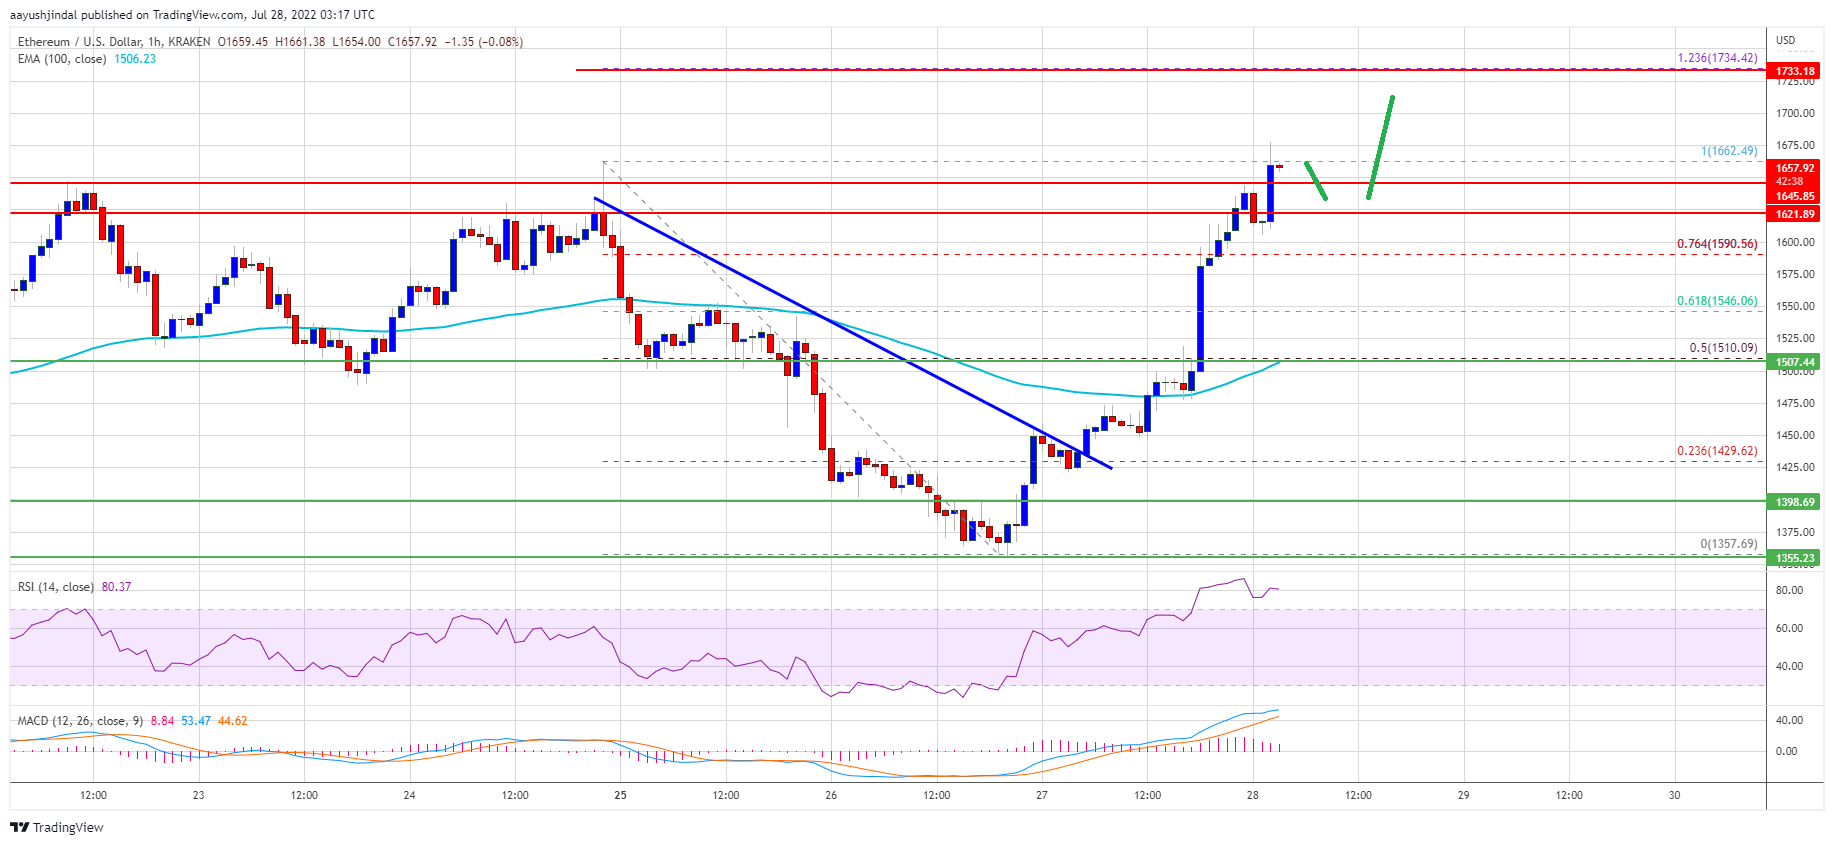
Source: ETHUSD on TradingView.com
The main resistance is now forming near the $1,735 zone. It is near the 1.236 Fib extension level of the downward move from the $1,663 swing high to $1,357 low. A clear move above the $1,735 level could push the price further higher. In the stated case, the price may perhaps rise towards the $1,800 resistance zone.
Dips Supported in ETH?
If ethereum fails to rise above the $1,675 resistance, it could start a downside correction. An initial support on the downside is near the $1,620 zone.
A clear move below the $1,620 support might spark a move towards the $1,580 level. Any more losses might even push the price to the $1,510 support or even the 100 hourly simple moving average in the near term.
Technical Indicators
Hourly MACD – The MACD for ETH/USD is now losing momentum in the bullish zone.
Hourly RSI – The RSI for ETH/USD is now in the overbought zone.
Major Support Level – $1,620
Major Resistance Level – $1,675


