
Reason to trust
How Our News is Made
Strict editorial policy that focuses on accuracy, relevance, and impartiality
Ad discliamer
Morbi pretium leo et nisl aliquam mollis. Quisque arcu lorem, ultricies quis pellentesque nec, ullamcorper eu odio.
Ethereum formed a short-term top near $620 and started a sharp decline against the US Dollar. ETH price is correcting gains and it could revisit the $500 support zone.
- Ethereum started a downside correction after it failed to stay above the $580 support.
- The price traded below the $550 support and the 100 hourly simple moving average.
- There was a break below a major declining channel with support near $565 on the hourly chart of ETH/USD (data feed via Kraken).
- The pair tested the $507 level and it seems like there are chances of more downsides.
Ethereum Price Corrects Lower
After forming a short-term top near the $620 level, Ethereum started a sharp downside correction. ETH settled below the $600 level and it failed to stay above the $580 support level.
A clear break below the $580 support level sparked a strong decline (similar to bitcoin). Ether price declined heavily below the $550 support and it even settled well below the 100 hourly simple moving average. There was also a break below a major declining channel with support near $565 on the hourly chart of ETH/USD.
The price declined below the $520 support and traded as low as $507. It is currently recovering higher and trading above the $525 level. Ether is testing the 23.6% Fib retracement level of the recent decline from the $605 swing high to $507 low.
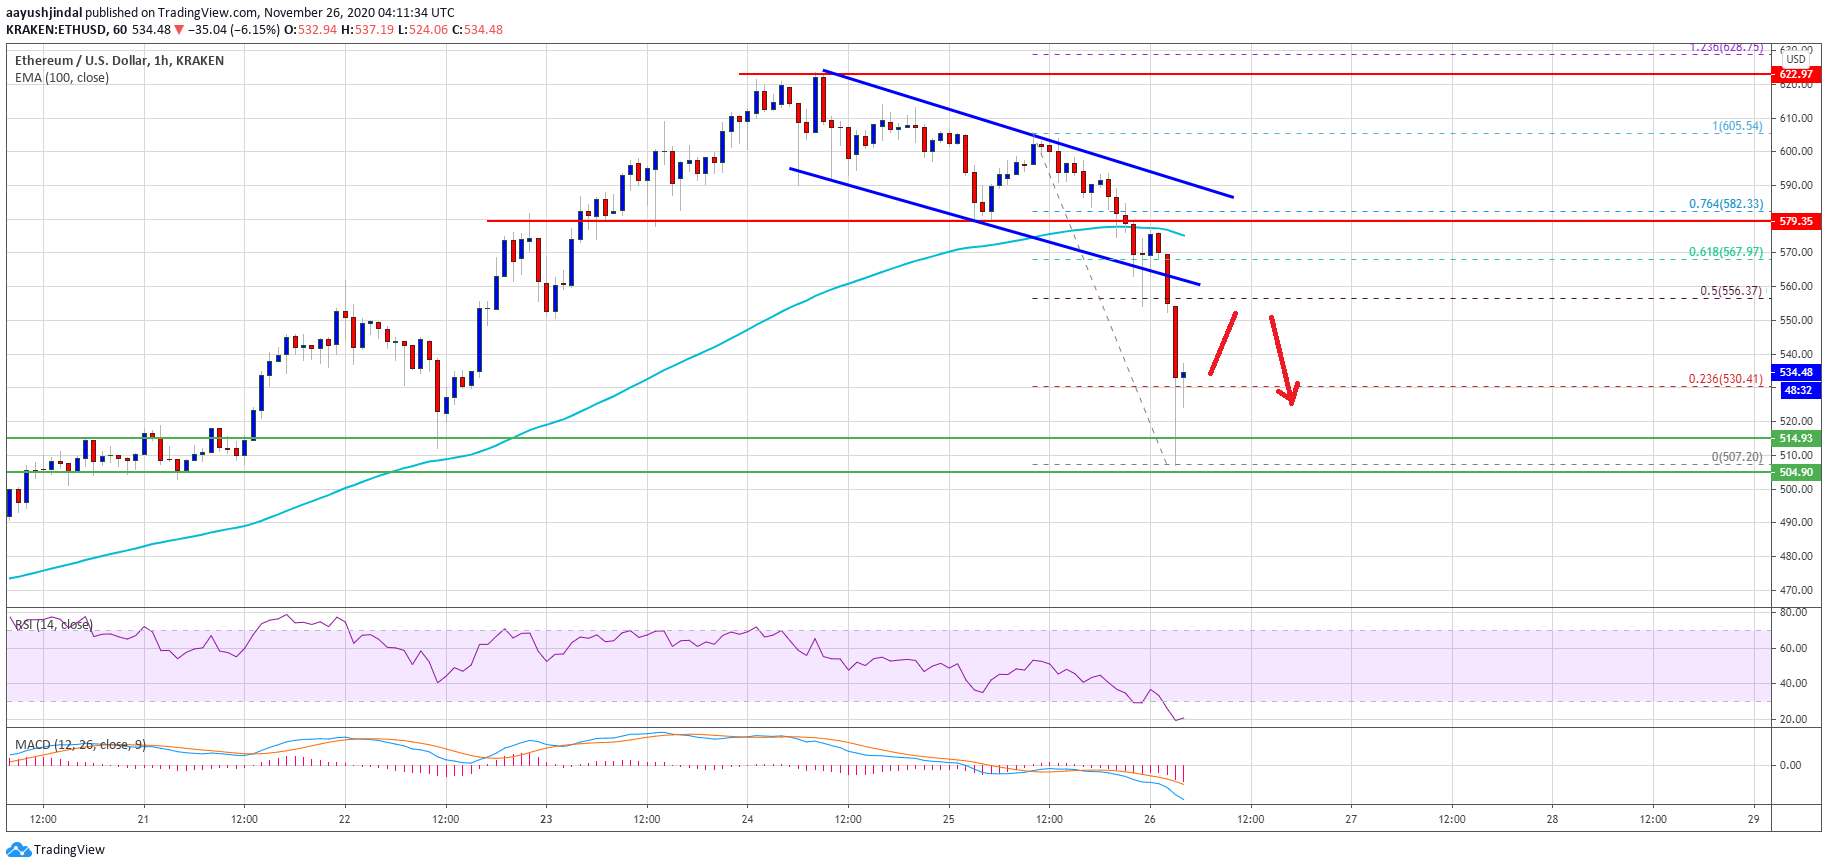
Source: ETHUSD on TradingView.com
On the upside, there is a major resistance forming near the $550 and $555 levels. The 50% Fib retracement level of the recent decline from the $605 swing high to $507 low is also near the $555 level.
The main resistance is forming near the $580 level and the 100 hourly simple moving average (the recent breakdown zone). A successful close above the $580 level is must to move back into a positive zone.
More Losses in ETH?
If ethereum fails to recover above the $550 resistance, there could be more losses. The first major support is near the $515 level, below which the price could retest the $507 low.
The main support is near the $500 handle. A clear break below the $500 handle might start a substantial decrease. In the mentioned case, the price could even test $450.
Technical Indicators
Hourly MACD – The MACD for ETH/USD is now gaining momentum in the bearish zone.
Hourly RSI – The RSI for ETH/USD is now well below the 30 level.
Major Support Level – $500
Major Resistance Level – $550


