
Reason to trust
How Our News is Made
Strict editorial policy that focuses on accuracy, relevance, and impartiality
Ad discliamer
Morbi pretium leo et nisl aliquam mollis. Quisque arcu lorem, ultricies quis pellentesque nec, ullamcorper eu odio.
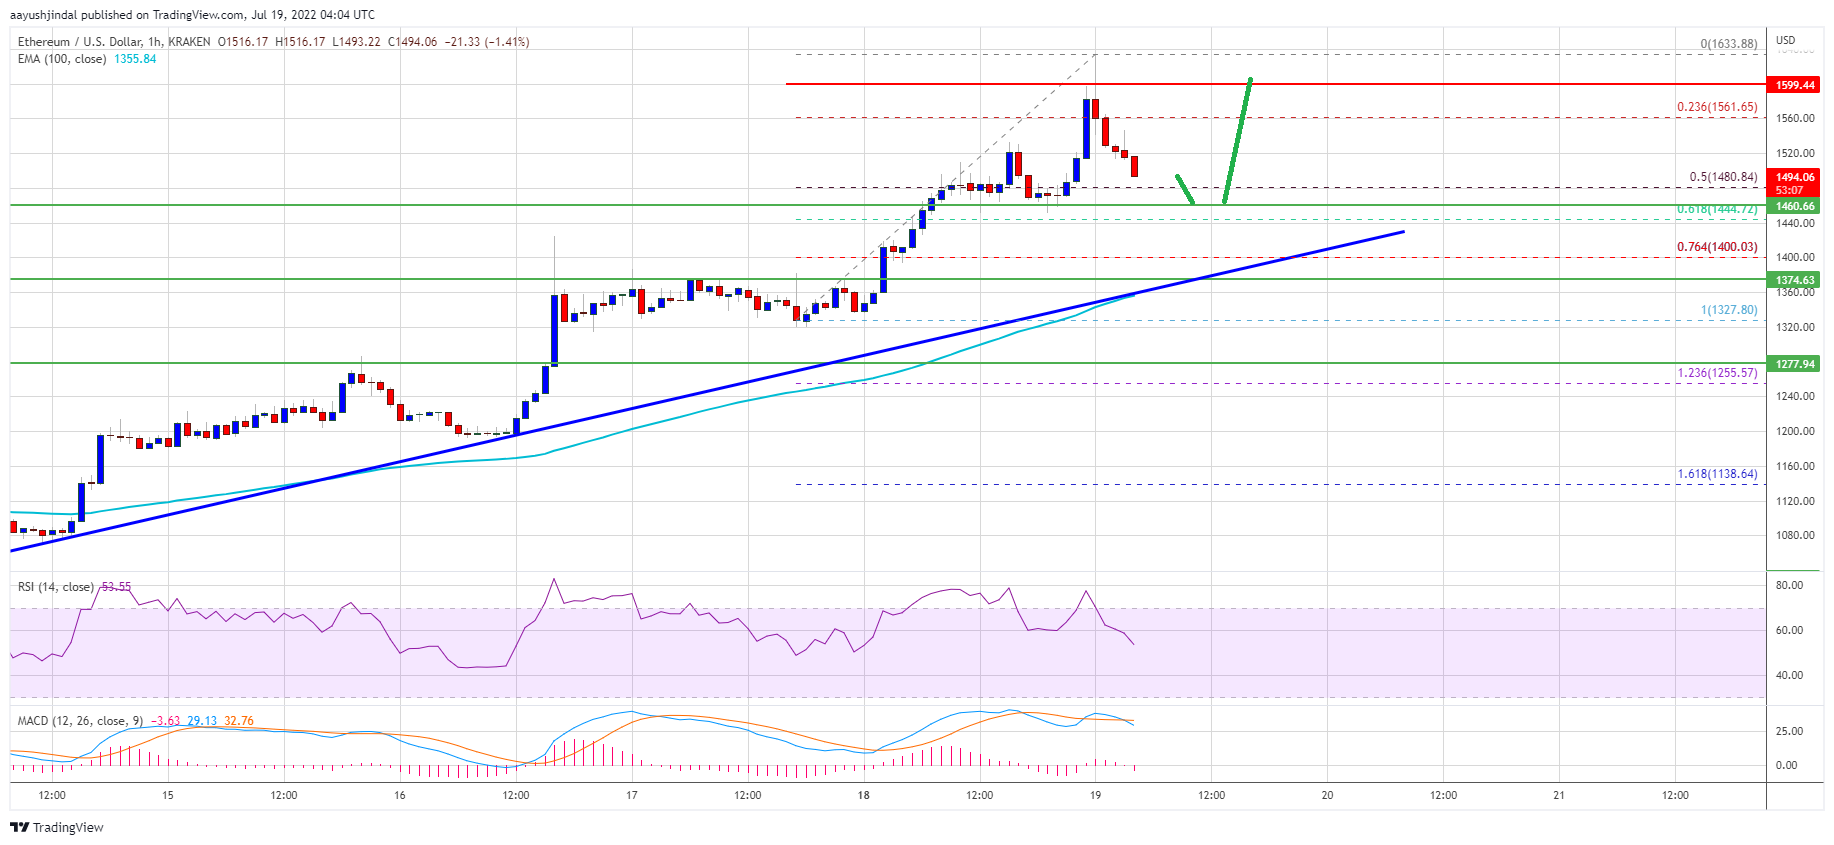
Ethereum extended its rally above the $1,550 resistance against the US Dollar. ETH is correcting gains but dips might find bids near $1,460.
- Ethereum gained bullish momentum and even surpassed the $1,550 resistance.
- The price is now trading above $1,500 and the 100 hourly simple moving average.
- There is a key bullish trend line forming with support near $1,420 on the hourly chart of ETH/USD (data feed via Kraken).
- The pair could continue to gain pace if there is a clear move above the $1,600 zone.
Ethereum Price Extended Rally
Ethereum gained pace after there was a clear move above the $1,350 and $1,400 levels. ETH cleared the $1,500 resistance zone to move further into a positive zone.
The price even rallied above the $1,550 resistance zone and settled well above the 100 hourly simple moving average. Ether price even spiked above the $1,600 level and traded to a new multi-week high at $1,633. It is now correcting gains below the $1,600 level.
There was a move below the 23.6% Fib retracement level of the recent rally from the $1,327 swing low to $1,633 high. However, there are many supports near $1,460. There is also a key bullish trend line forming with support near $1,420 on the hourly chart of ETH/USD.
Source: ETHUSD on TradingView.com
An immediate resistance on the upside is near the $1,530 level. The first major resistance is near the $1,550 zone. A clear move above the $1,550 level could send the price higher. The next key barrier is near the $1,620 level, above which the price gain strength and rise towards the $1,700 resistance zone.
Dips Limited in ETH?
If ethereum fails to rise above the $1,550 resistance, it could start a downside correction. An initial support on the downside is near the $1,480 zone. The next major support is near the $1,460 zone.
The 50% Fib retracement level of the recent rally from the $1,327 swing low to $1,633 high is also near $1,460. Any more losses might even push ether price below the trend line support. In the stated case, the price could drop toward the $1,360 level or the 100 hourly simple moving average.
Technical Indicators
Hourly MACD – The MACD for ETH/USD is now losing momentum in the bullish zone.
Hourly RSI – The RSI for ETH/USD is moving towards the 50 level.
Major Support Level – $1,420
Major Resistance Level – $1,550


