
Reason to trust
How Our News is Made
Strict editorial policy that focuses on accuracy, relevance, and impartiality
Ad discliamer
Morbi pretium leo et nisl aliquam mollis. Quisque arcu lorem, ultricies quis pellentesque nec, ullamcorper eu odio.
Ethereum’s ether started a fresh increase above $385, following bitcoin’s rise above $13,800 against the US Dollar. ETH price is likely to continue higher towards $420 and $425.
- Ethereum is up over 5% and it broke the key $400 resistance level.
- The price is now trading above $404 and the 100 hourly simple moving average.
- There was a break above a major contracting triangle with resistance near $385 on the hourly chart of ETH/USD (data feed via Kraken).
- The pair is likely to continue higher once it clears the $408 and $410 levels.
Ethereum Price is Gaining Bullish Momentum
After finding a strong support near $372, Ethereum started a fresh increase. Bitcoin price rallied above $13,800 and $14,000, resulting in a decent increase in ETH above the $388 and $395 resistance levels.
The recent rally was initiated after there was a break above a major contracting triangle with resistance near $385 on the hourly chart of ETH/USD. Ether price even cleared the $400 resistance level and settled well above the 100 hourly simple moving average.
A new monthly high is formed near $408 and the price is currently consolidating gains. An initial support is near the $402 and $401 levels. The 23.6% Fib retracement level of the recent increase from the $379 swing low to $408 high is also near the $401 level.
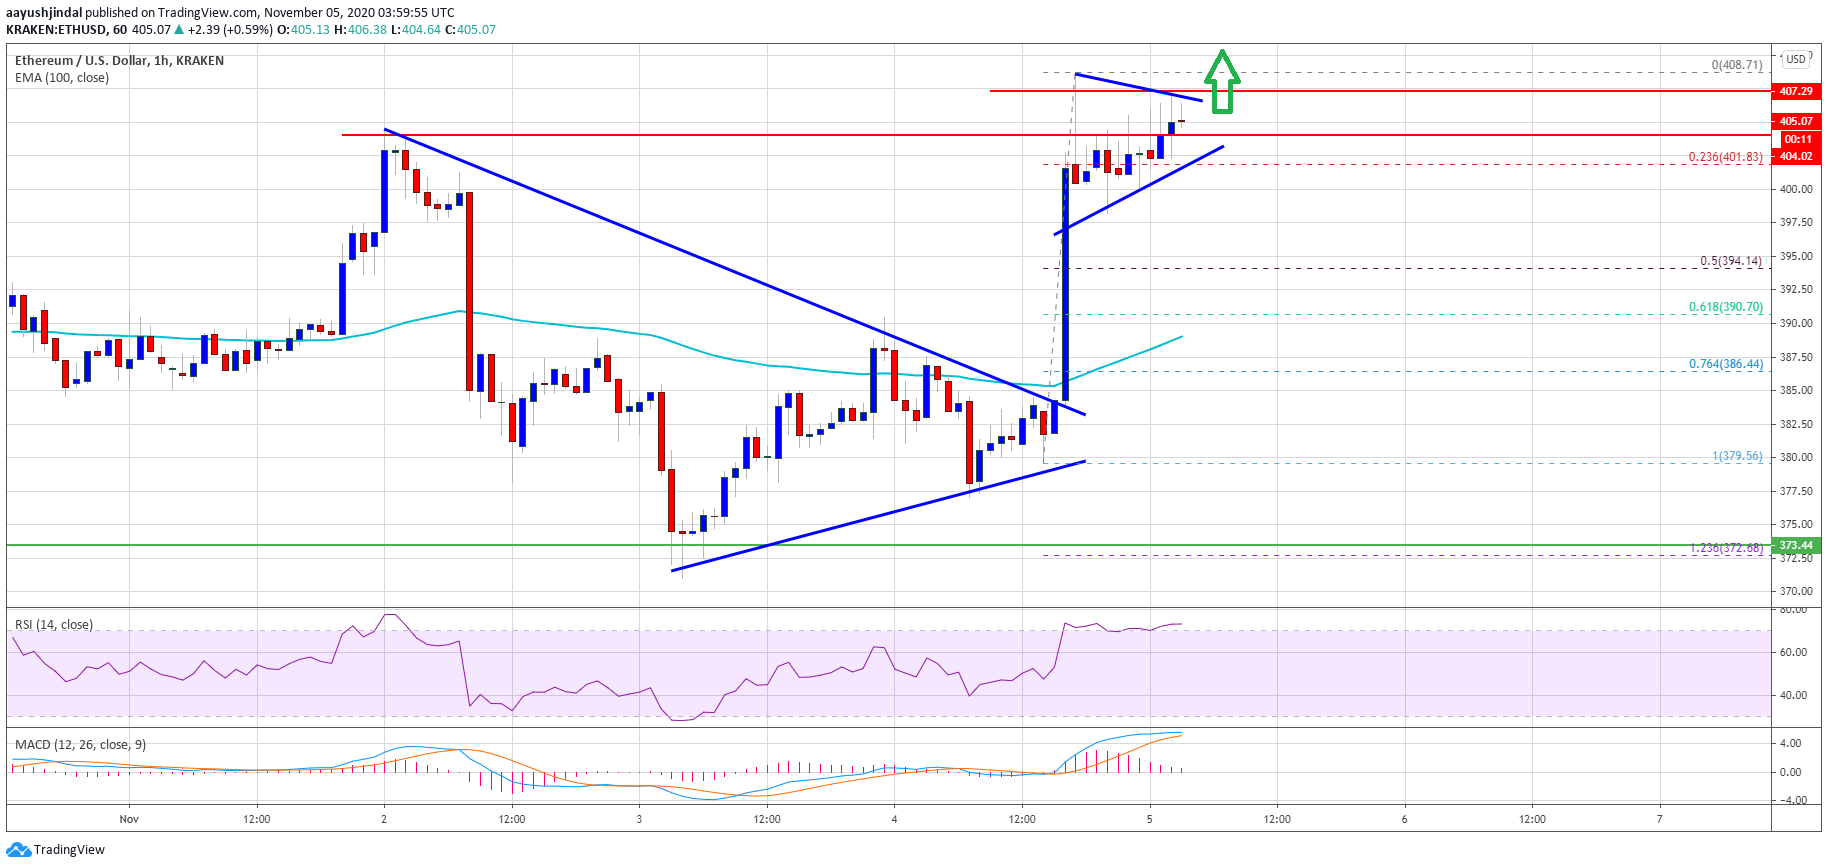
Source: ETHUSD on TradingView.com
It seems like there is a key contracting triangle forming with resistance near $407 on the same chart. A clear break above the triangle resistance and $208 could open the doors for more upsides.
The next immediate resistance is near the $412 level, above which the bulls are likely to aim a larger rally towards the $420 and $425 resistance levels in the coming sessions.
Downside Limited in ETH?
If Ethereum fails to clear the $407 and $408 resistance levels, it could correct lower. An initial support on the downside is near the $400 level and the triangle lower trend line.
If there is a downside break below the triangle support at $401 and $400, ether price might decline towards the $395 support. It is close to the 50% Fib retracement level of the recent increase from the $379 swing low to $408 high.
Technical Indicators
Hourly MACD – The MACD for ETH/USD is slowly losing momentum in the bullish zone.
Hourly RSI – The RSI for ETH/USD is now well above the 60 level.
Major Support Level – $400
Major Resistance Level – $408


