
Reason to trust
How Our News is Made
Strict editorial policy that focuses on accuracy, relevance, and impartiality
Ad discliamer
Morbi pretium leo et nisl aliquam mollis. Quisque arcu lorem, ultricies quis pellentesque nec, ullamcorper eu odio.
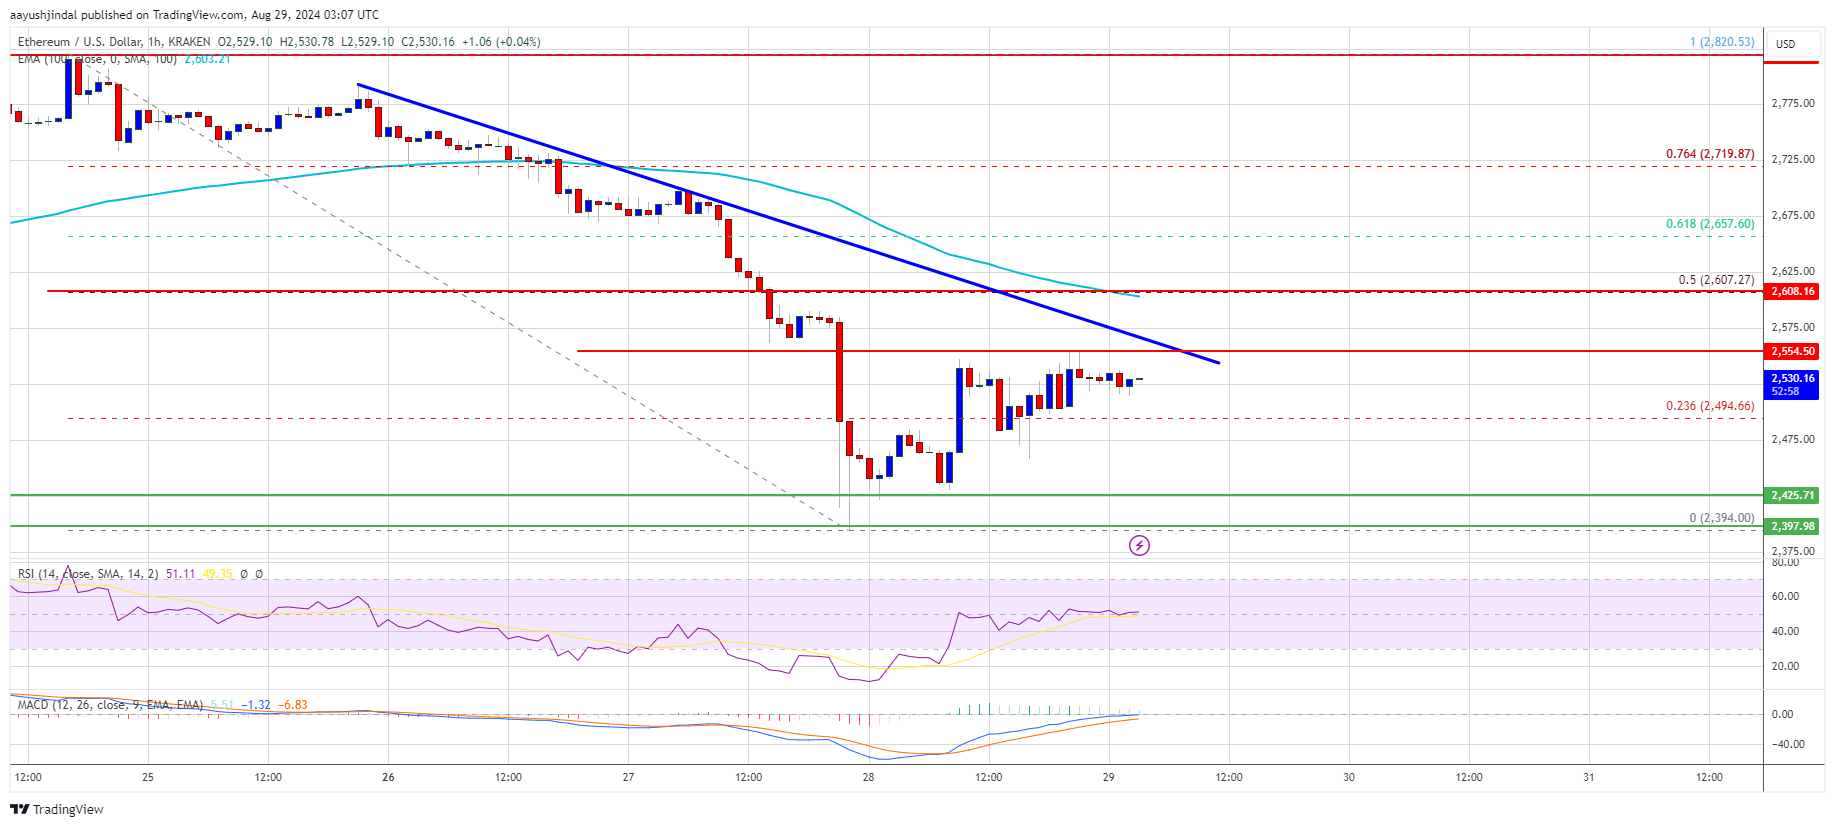
Ethereum price tested the $2,400 zone and recovered some losses. ETH must clear the $2,550 resistance zone to start a decent increase in the near term.
- Ethereum started a consolidation phase after a sharp decline to $2,400.
- The price is trading below $2,550 and the 100-hourly Simple Moving Average.
- There is a key bearish trend line forming with resistance at $2,555 on the hourly chart of ETH/USD (data feed via Kraken).
- The pair could start a recovery wave if it clears the $2,555 and $2,600 resistance levels.
Ethereum Price Eyes Recovery
Ethereum price extended its decline below the $2,650 level. ETH even traded below the $2,550 and $2,500 support levels like Bitcoin. Finally, the bulls appeared near the $2,400 zone.
A low was formed at $2,394 and the price recently started a minor recovery wave. There was a move above the $2,450 and $2,480 levels. It broke the 23.6% Fib retracement level of the downward wave from the $2,820 swing high to the $2,394 low.
Ethereum price is now trading below $2,550 and the 100-hourly Simple Moving Average. On the upside, the price seems to be facing hurdles near the $2,550 level. There is also a key bearish trend line forming with resistance at $2,555 on the hourly chart of ETH/USD.
The first major resistance is near the $2,600 level. It is near the 50% Fib retracement level of the downward wave from the $2,820 swing high to the $2,394 low. A close above the $2,600 level might send Ether toward the $2,665 resistance.
The next key resistance is near $2,720. An upside break above the $2,720 resistance might send the price higher toward the $2,820 resistance zone in the near term.
Another Decline In ETH?
If Ethereum fails to clear the $2,555 resistance, it could start another decline. Initial support on the downside is near $2,480. The first major support sits near the $2,450 zone.
A clear move below the $2,450 support might push the price toward $2,425 where the bulls could emerge. Any more losses might send the price toward the $2,320 support level in the near term. The next key support sits at $2,250.
Technical Indicators
Hourly MACD – The MACD for ETH/USD is losing momentum in the bearish zone.
Hourly RSI – The RSI for ETH/USD is now above the 50 zone.
Major Support Level – $2,450
Major Resistance Level – $2,550


