
Reason to trust
How Our News is Made
Strict editorial policy that focuses on accuracy, relevance, and impartiality
Ad discliamer
Morbi pretium leo et nisl aliquam mollis. Quisque arcu lorem, ultricies quis pellentesque nec, ullamcorper eu odio.
Ethereum price started a recovery wave above the $3,000 zone. ETH is now above the 100-hourly simple moving average and facing hurdles.
- Ethereum found support at $2,820 and started a recovery wave.
- The price is trading above $3,100 and the 100-hourly Simple Moving Average.
- There is a key bullish trend line forming with support at $3,110 on the hourly chart of ETH/USD (data feed via Kraken).
- The pair could gain bullish momentum if it clears the $3,165 resistance zone.
Ethereum Price Holds Ground
Ethereum price remained stable and started a recovery wave above the $3,000 level, like Bitcoin. ETH was able to clear the $3,050 and $3,120 resistance levels.
However, the bears were active near the $3,165 resistance zone. A high was formed at $3,168 and the price started a downside correction. There was a minor move below the $3,150 level. The price is now stable above the 23.6% Fib retracement level of the upward move from the $2,813 swing low to the $3,168 high.
Ethereum is also above $3,100 and the 100-hourly Simple Moving Average. Besides, there is a key bullish trend line forming with support at $3,110 on the hourly chart of ETH/USD.
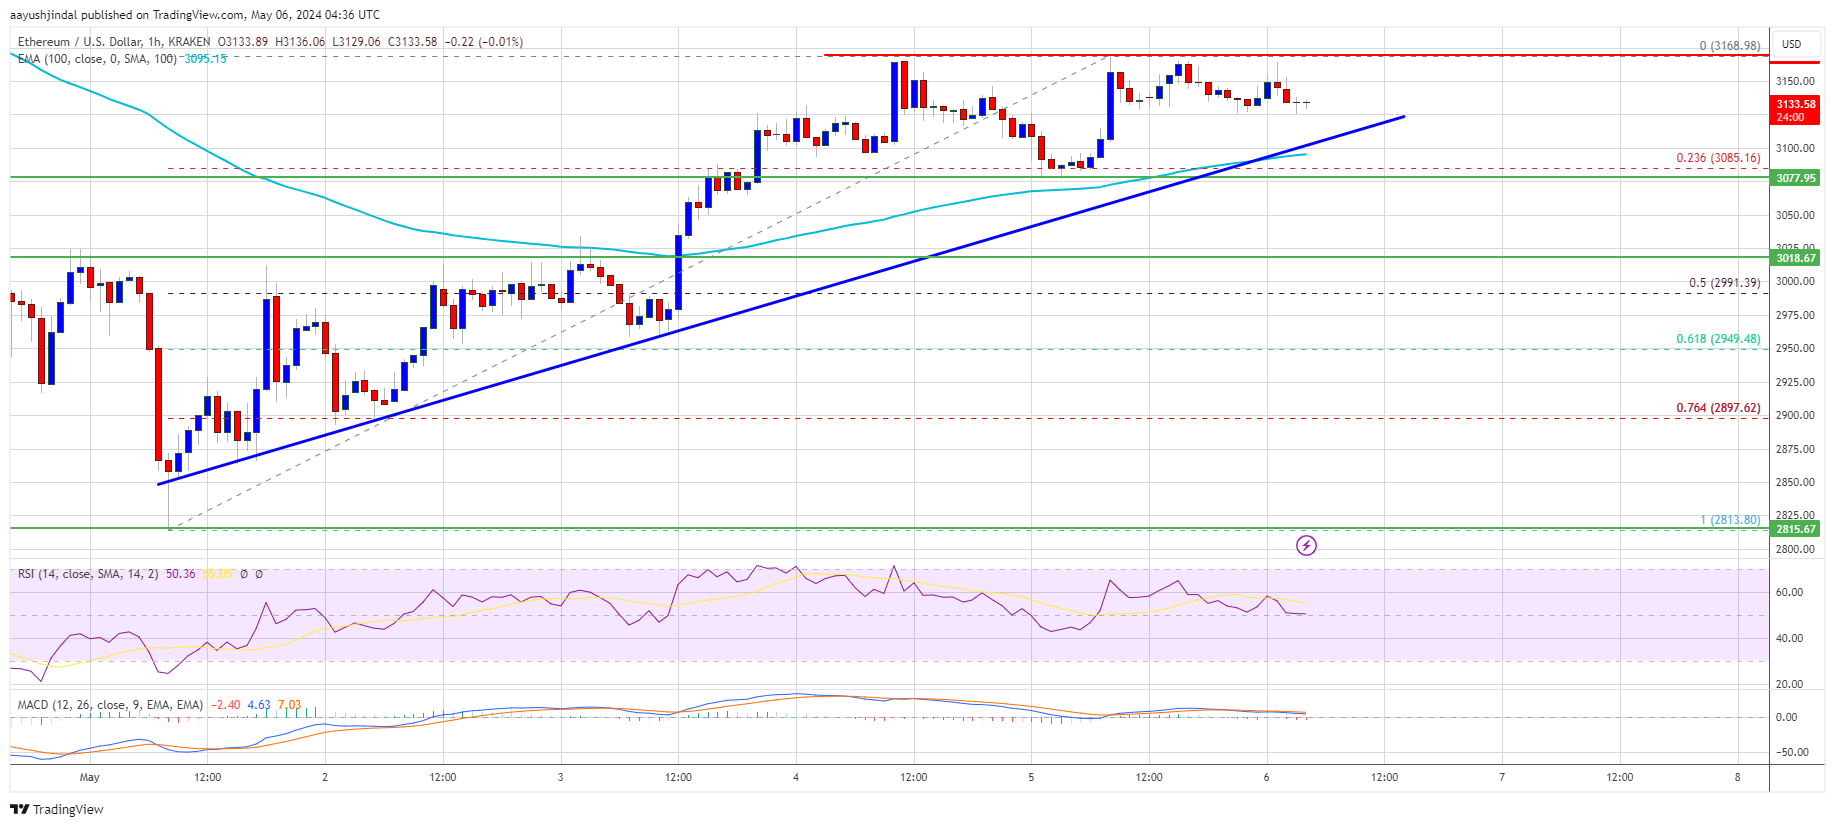
Source: ETHUSD on TradingView.com
Immediate resistance is near the $3,165 level. The first major resistance is near the $3,200 level. The next key resistance sits at $3,250, above which the price might gain traction and rise toward the $3,350 level. If the bulls remain in action and push the price above $3,350, there could be a drift toward the $3,500 resistance. Any more gains could send Ether toward the $3,620 resistance zone.
Another Decline In ETH?
If Ethereum fails to clear the $3,165 resistance, it could start another decline. Initial support on the downside is near the $3,100 level and the trend line. The first major support is near the $3,000 zone or the 50% Fib retracement level of the upward move from the $2,813 swing low to the $3,168 high.
The main support is near the $2,940 level. A clear move below the $2,940 support might push the price toward $2,820. Any more losses might send the price toward the $2,650 level in the near term.
Technical Indicators
Hourly MACD – The MACD for ETH/USD is losing momentum in the bullish zone.
Hourly RSI – The RSI for ETH/USD is now above the 50 level.
Major Support Level – $3,000
Major Resistance Level – $3,165


