
Reason to trust
How Our News is Made
Strict editorial policy that focuses on accuracy, relevance, and impartiality
Ad discliamer
Morbi pretium leo et nisl aliquam mollis. Quisque arcu lorem, ultricies quis pellentesque nec, ullamcorper eu odio.
Ethereum price is slowly moving higher above $1,600 against the US Dollar. ETH could gain bullish momentum unless there is a nasty drop below $1,550.
- Ethereum is showing a few positive signs for a move above the $1,650 resistance.
- The price is trading above $1,600 and the 100-hourly Simple Moving Average.
- There was a break above a key bearish trend line with resistance near $1,610 on the hourly chart of ETH/USD (data feed via Kraken).
- The pair could start a decent increase if there is a close above $1,650 and $1,670.
Ethereum Price Shows Bullish Signs
Ethereum’s price remained well-supported above the $1,550 level. ETH climbed higher slowly above the $1,580 and $1,600 resistance levels, like Bitcoin.
There was a break above a key bearish trend line with resistance near $1,610 on the hourly chart of ETH/USD. The pair even broke the $1,620 resistance. However, the bears are still active below the $1,650 level. A high is formed near $1,638 and the price is now consolidating gains.
Ether is now trading above $1,600 and the 100-hourly Simple Moving Average. It is also above the 23.6% Fib retracement level of the recent increase from the $1,530 swing low to the $1,638 high.
On the upside, the price might face resistance near the $1,635 level. The next resistance is near the $1,650 level. A close above the $1,650 resistance might send the price toward the $1,670 resistance. If the price reclaims the $1,670 resistance, there could be a steady increase.
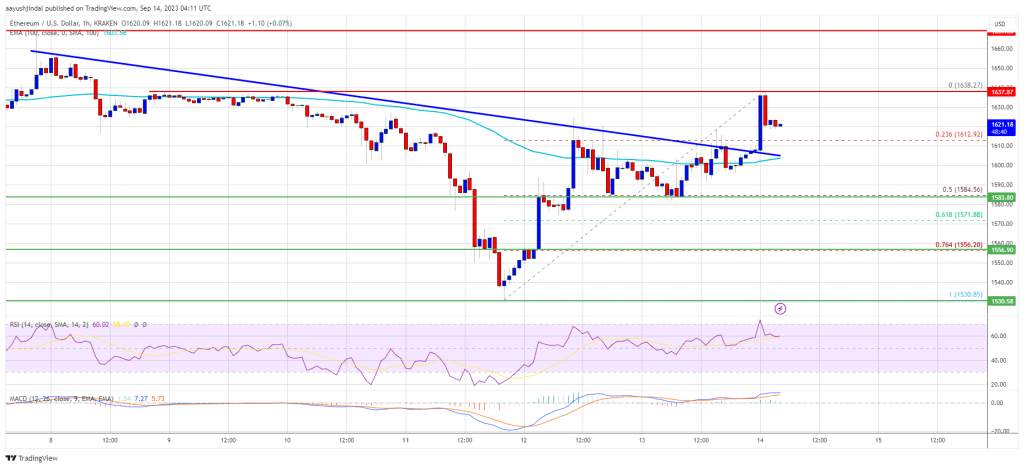
Source: ETHUSD on TradingView.com
The next major hurdle is near the $1,750 level. A close above the $1,750 level might send Ethereum further higher toward $1,880.
Another Drop in ETH?
If Ethereum fails to clear the $1,650 resistance, it could start another decline. Initial support on the downside is near the $1,600 level and the 100-hourly Simple Moving Average.
The first key support is close to $1,585 and the 50% Fib retracement level of the recent increase from the $1,530 swing low to the $1,638 high. The next key support is $1,550. A downside break below $1,550 might spark a fresh round of selling. In the stated case, the price could even decline toward the $1,500 level in the near term.
Technical Indicators
Hourly MACD – The MACD for ETH/USD is gaining momentum in the bullish zone.
Hourly RSI – The RSI for ETH/USD is now above the 50 level.
Major Support Level – $1,600
Major Resistance Level – $1,650


